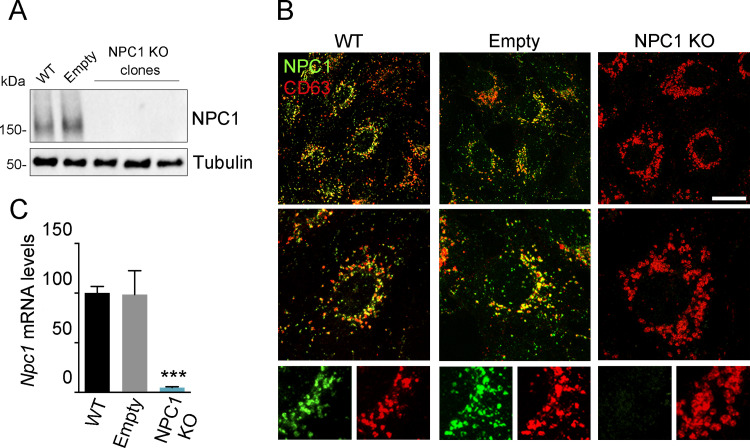
Fig 4. Validation of CRISPR KO NPC1 cells.
(A) Immunoblot of NPC1 and tubulin (loading control) in samples from WT, Empty and clones of NPC1 KO cells. (B) Visualization NPC1 (green) in late endosomes (CD63, red) in WT, Empty and NPC1 Vero KO cells. Scale bar: 25 μm. Zoom images are also shown. (C) Npc1 mRNA levels in WT, Empty and NPC1 KO cells as detected by qPCR. Graph represents mean±sem of three independent experiments. Statistically significant differences are indicated by asterisks (***p < 0.001).

