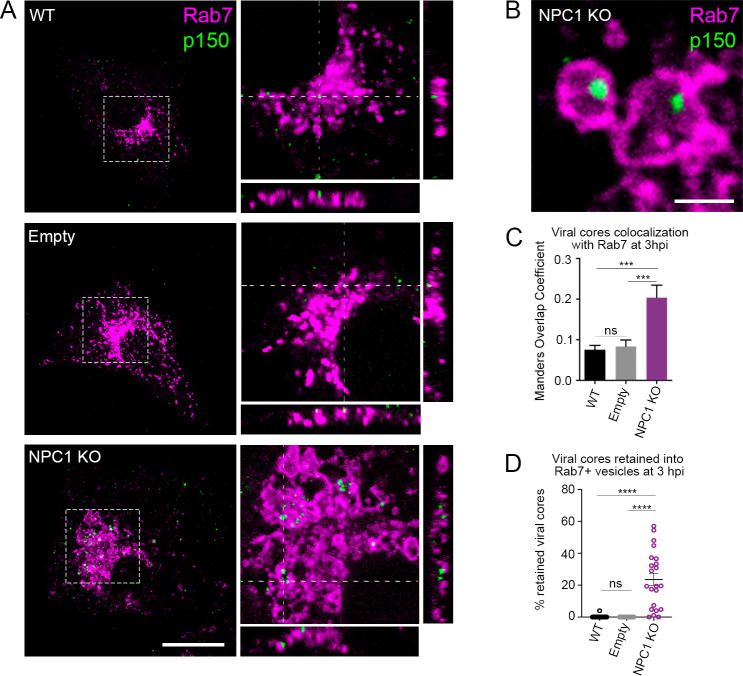
Fig 5. Viral cores visualized inside dilated late endosomes in ASFV infected NPC1 KO cells.
(A) Representative micrographs of control cells (WT and Empty) and NPC1 KO cells infected at a MOI of 50 pfu/ml for 3hpi. Viral cores and late endosomes were detected with an antibody against p150 (green) and Rab7 (magenta), respectively. Orthogonal projections showed viral cores and Rab7 positive membranes in the Z stack. Note that numbers of retained viral cores were higher in NPC1 KO cells compared to controls. Scale bar: 10μm. (B) Insets depict endosomes containing viral cores shown in detail. Scale bar: 2 μm. (C) Overlapping Manders coefficient (mean±sem) from 2 independent experiments (n = ca. 25). (D) Percentages of viral cores inside endosomes (mean±sem) from 2 independent experiments (n = ca. 25). Statistically significant differences are indicated by asterisks (****p < 0.0001, ***p < 0.001, ns-not significative).

