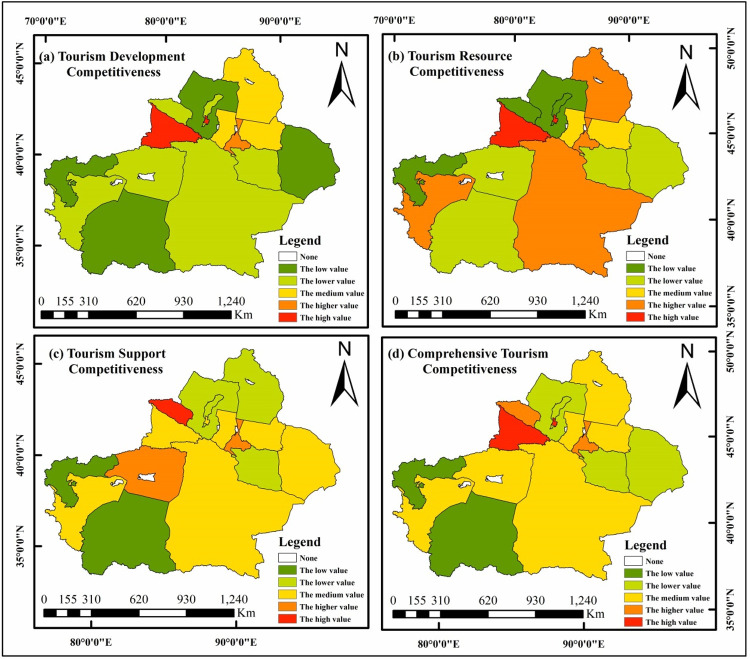
Fig 1.
(a-d). Spatial difference analysis of tourism competitiveness in 14 regions of Xinjiang. Based on the results of tourism development competitiveness, resource competitiveness, support competitiveness, and comprehensive competitiveness, the ArcGIS spatial analysis function are used for classification, and the color indicates the strength of competitiveness. The blank area is the Xinjiang Production and Construction Corps, which is not within the scope of statistics. The base layer was downloaded from The Gateway to Astronaut Photography of Earth website (https://eol.jsc.nasa.gov/SearchPhotos/). Map credit: Haijun Liu.

