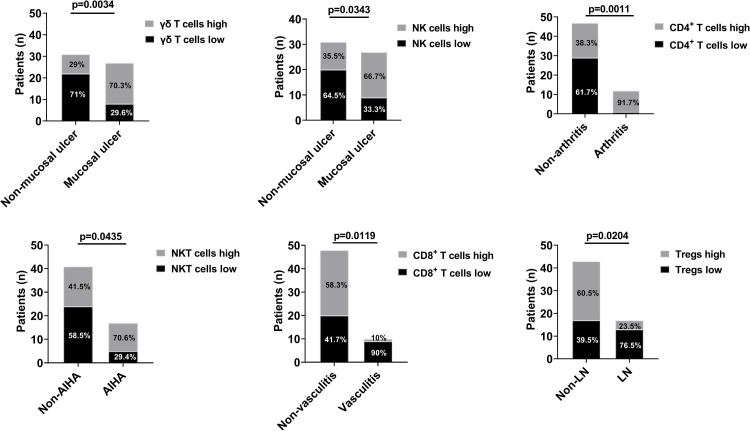
Fig 3. Associations between lymphocyte subsets and clinical manifestations in juvenile-onset systemic lupus erythematosus.
Data are presented as number of patients (Y-axis) and the presence of each clinical presentation (X-axis). Patients were stratified into 2 groups based on the median percentage of each subset. Percentage of patients are presented (stacked bar chart) as high (light color) and low groups (dark color). n, number of patients; Tregs, regulatory T cells; NK cells, natural killer cells; NKT cells, natural killer T cells; AIHA, autoimmune hemolytic anemia; LN, lupus nephritis.

