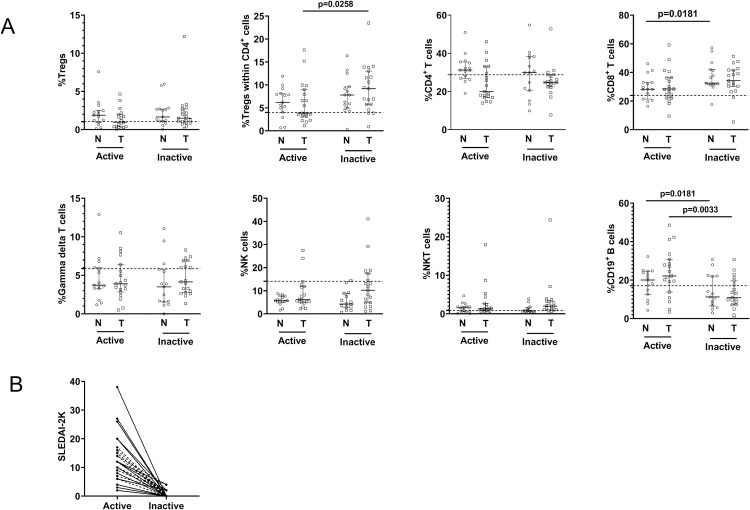
Fig 4. Lymphocyte subset distribution during longitudinal follow-up in JSLE patients, stratified into treatment-naïve and treated groups.
(A) Percentages of lymphocyte subsets in 34 JSLE patients during active disease and follow-up until inactive disease (treatment-naïve patients = 15, treated patients = 19), (B) Disease activity measured by SLEDAI-2K during active disease and follow-up until inactive disease in 34 JSLE patients. Horizontal solid lines represent medians and interquartile ranges. The dashed horizontal lines in (A) show the medians for healthy controls. The dashed lines in (B) represent individual treatment-naïve patients, and solid lines in (B) represent individual treated patients. JSLE, juvenile-onset systemic lupus erythematosus; Tregs, regulatory T cells; NK cells, natural killer cells; NKT cells, natural killer T cells; N, treatment-naïve patients; T, treated patients; SLEDAI-2K, systemic lupus erythematosus disease activity index 2000.

