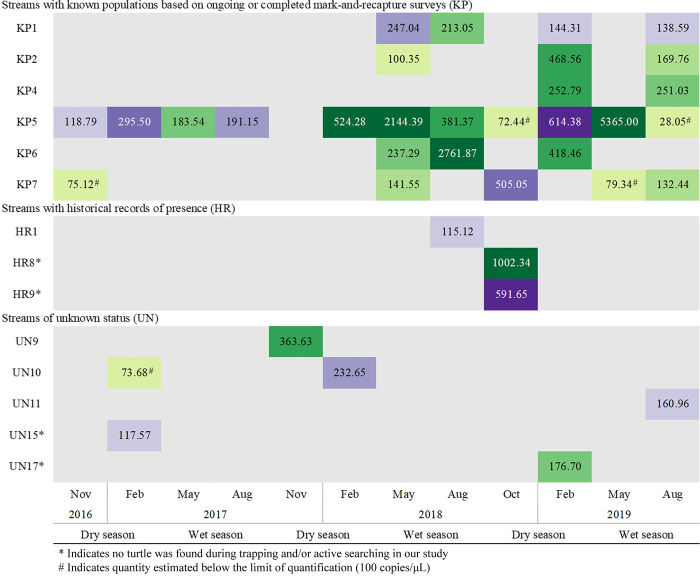
Fig 2. Heat map illustrating the concentration of eDNA detected in water samples from November 2016 to August 2019.
Each depth of color indicates a percentile of concentration level (interval = 0.2). A darker color represents a higher concentration level for positive detection (in green) and uncertain detection (in purple). Grey represents samples with no amplification, and categorized as negative detection.

