Figure 1. Mortality-adjusted cumulative incidence of heart failure at age 50 years.
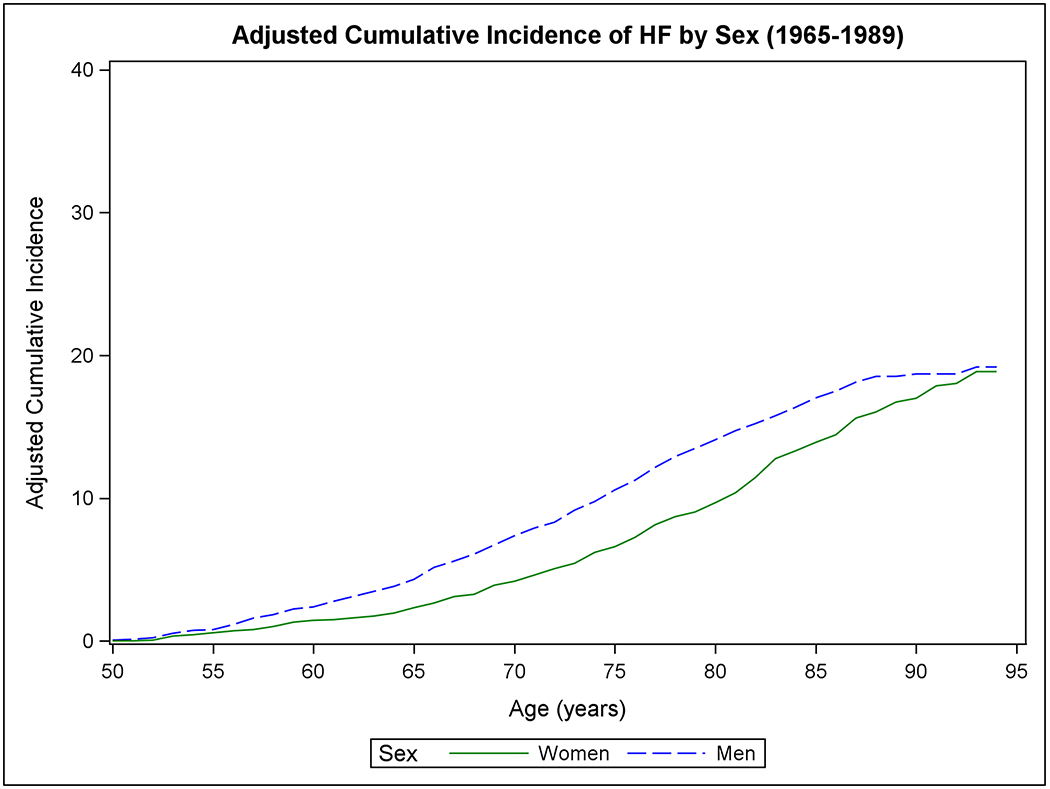
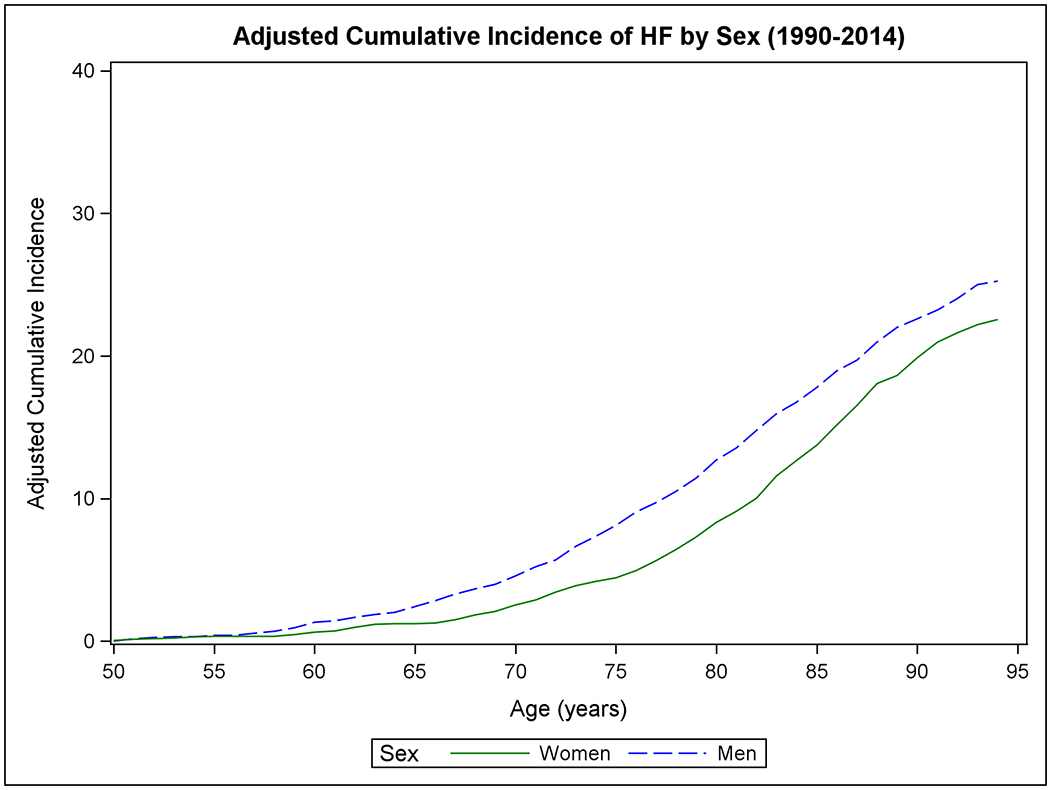
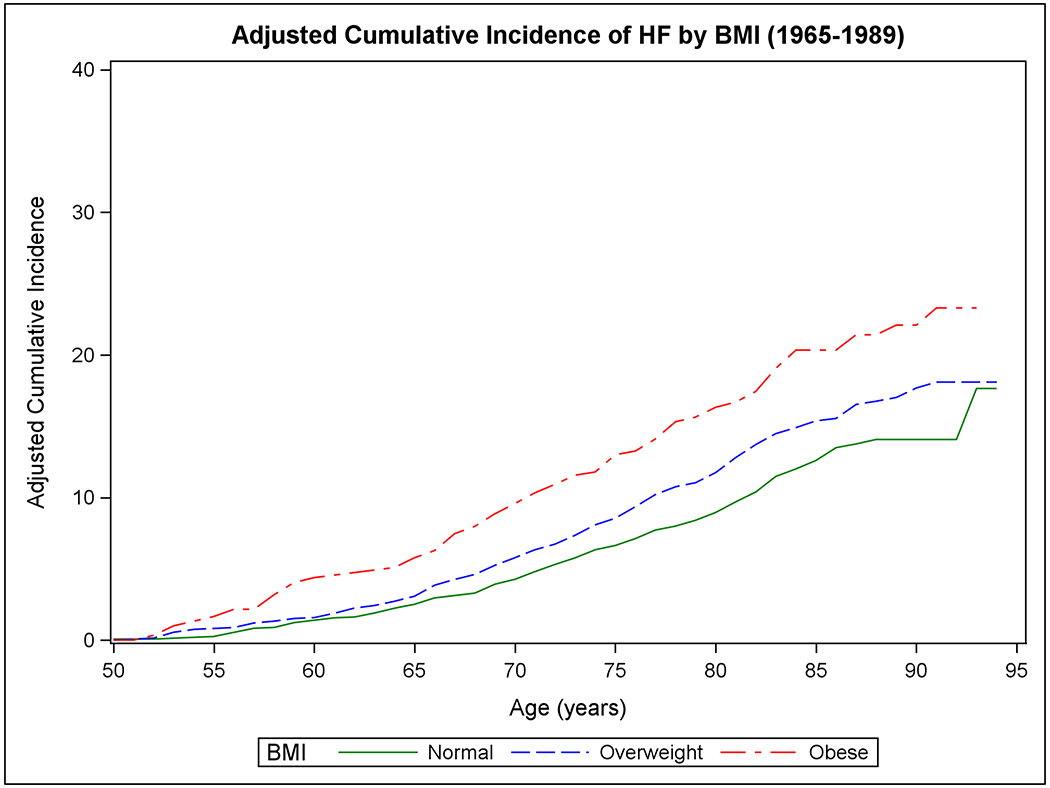
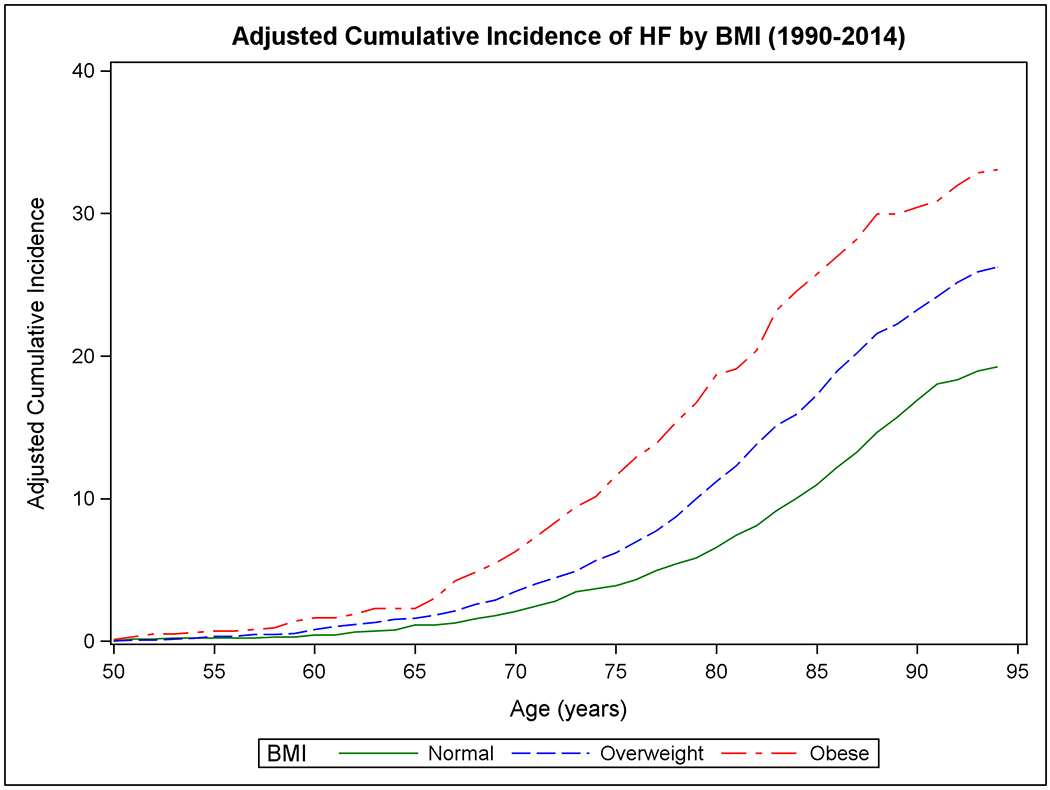
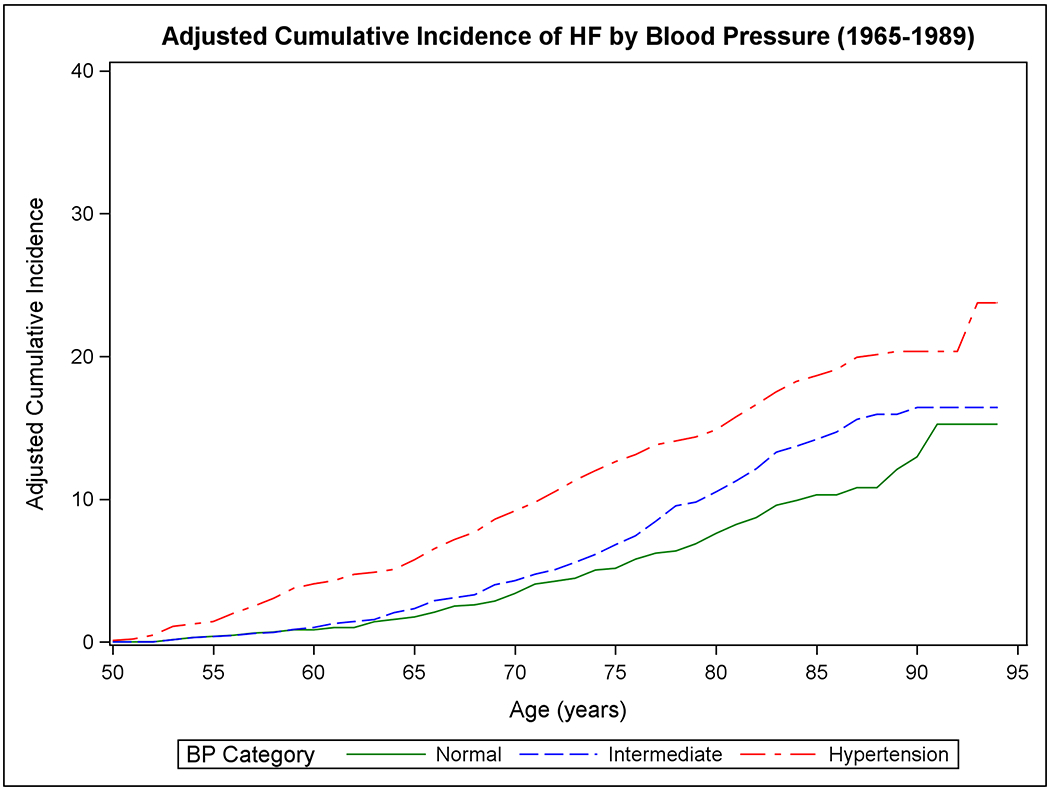
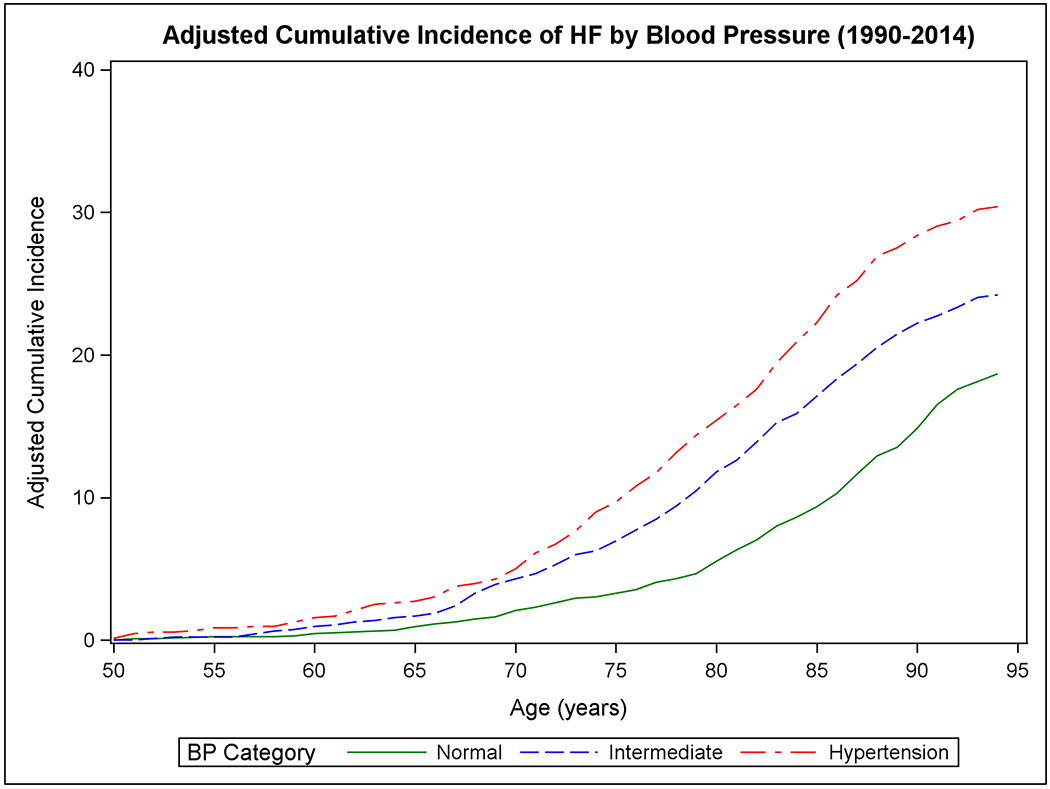
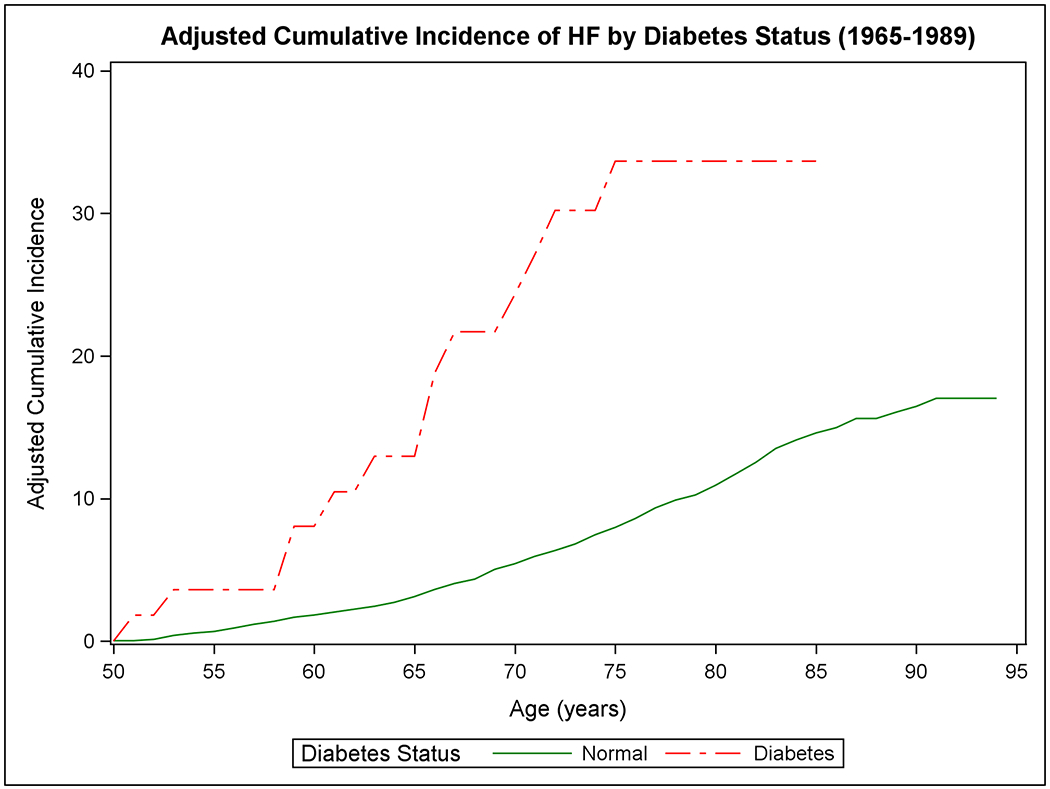
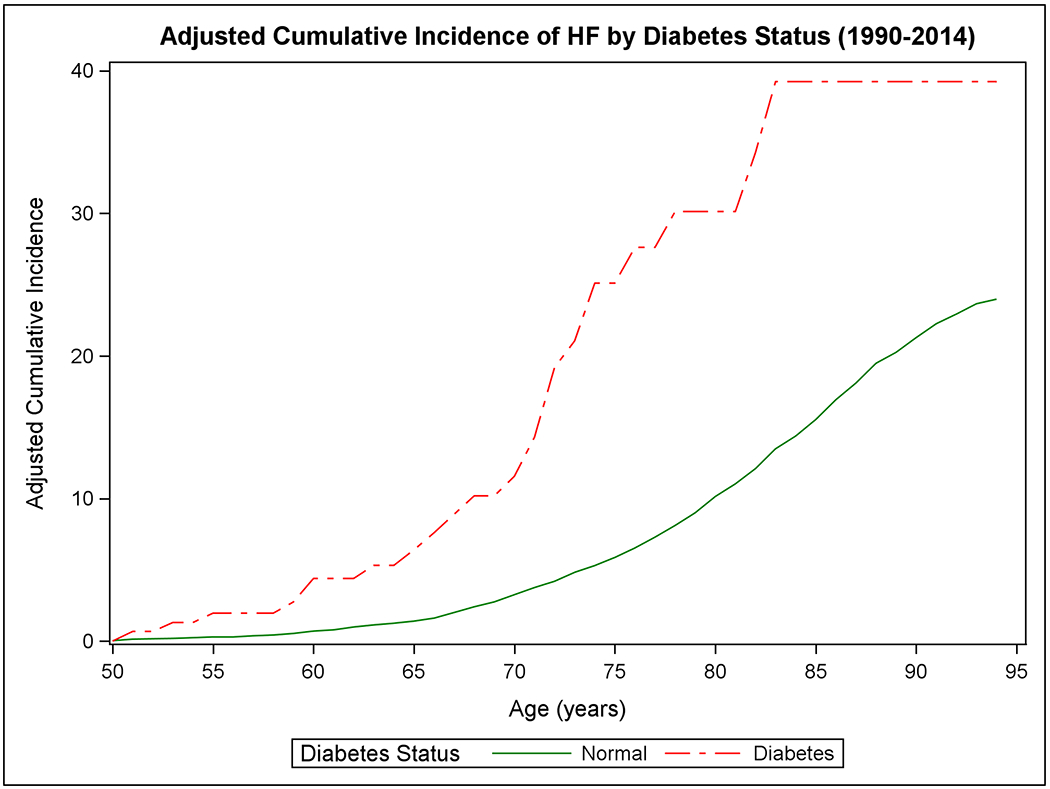
The cumulative incidence of heart failure in the two epochs is displayed by sex in Panels A-B, by BMI categories in Panels C-D, according to BP groups in Panels E-F, and by diabetes status in Panels G-H.
