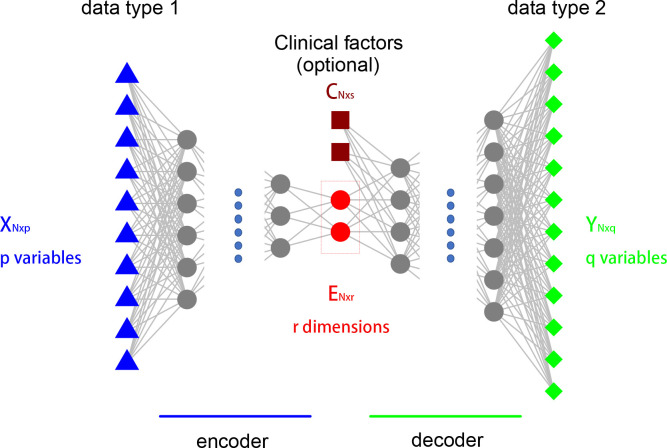
Fig 1. The setup of the model.
XN×p is the input data. There are p variables and N samples. YN×q is the output data. There are q variables and N samples. EN×r is the low-dimensional nonlinear data embedding, where r is small. Clinical confounders such as age, gender, ethnicity, batch etc, form the matrix CN×s.

