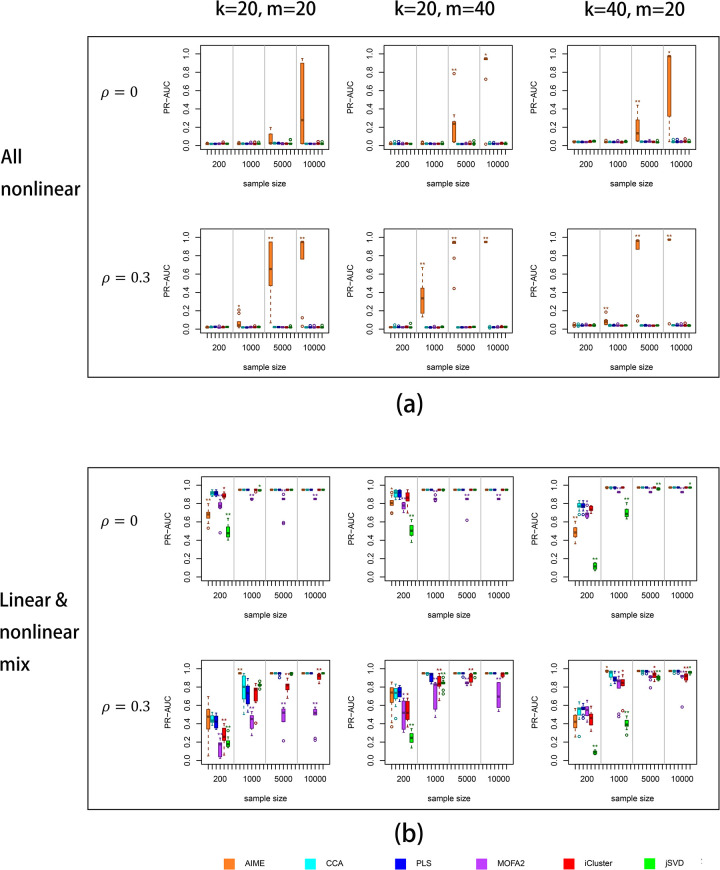
Fig 2. Simulation results.
PR-AUC was used to assess each method’s success in selecting the true contributing variables. (a) All relations are nonlinear; (b) The relations are mixed between nonlinear and linear. X-axis: sample size; Y-axis: PR-AUC values. For full simulation results, please see S1 Fig. The significance levels by Wilcoxon test against the CCA results were labeled on the plots: p≤0.01 (*); p≤0.001(**).

