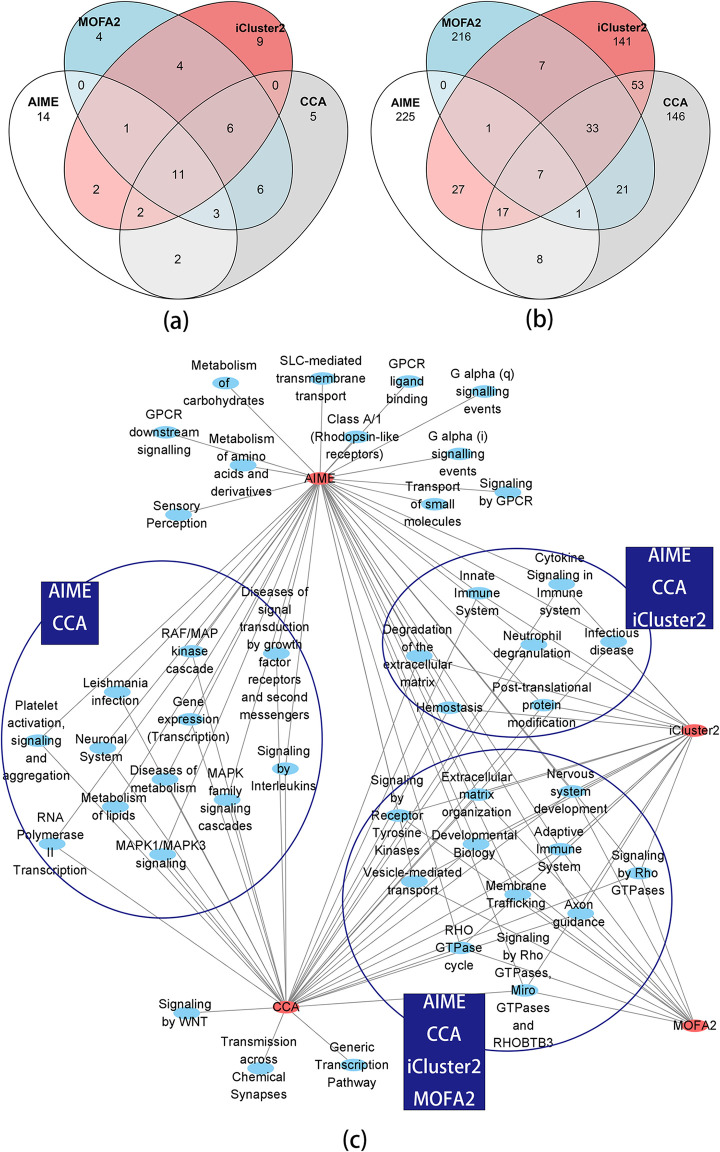
Fig 7. Venn Diagram of the top microRNAs, top genes, and functional analysis of the top genes.
Notice the functional analysis results of the microRNAs are in Table 1. (a) Venn diagram of the top 35 microRNAs selected by AIME (fdr≤0.01), and the top 35 microRNAs from CCA, iCluster2 and MOFA2. (b) Venn diagram of the top 286 genes selected by AIME (fdr≤0.05), and the top 286 genes from CCA, iCluster2 and MOFA2. (c) The overrepresented pathways (FDR≤0.05) with 100~500 genes.

