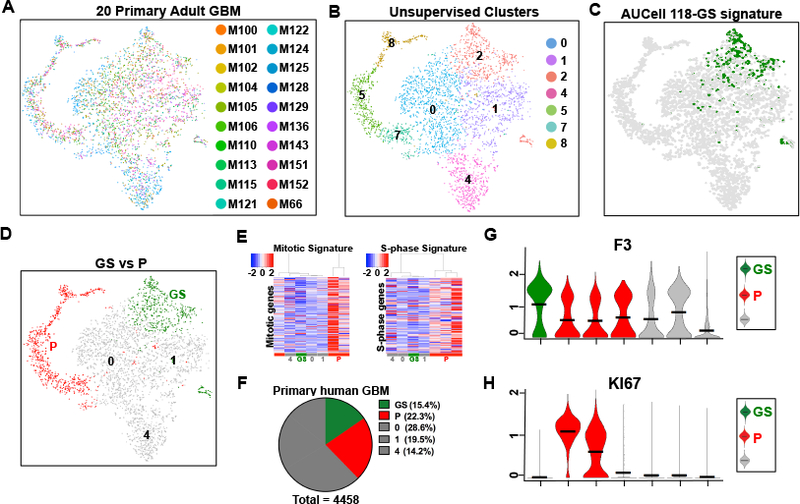
Figure 6. The 118-GS signature is enriched in non-proliferative primary GBM unsupervised cell clusters.
(A) Seurat v.3 tSNE depiction of the single cell sequencing data from 20 adult GBM described in Neftel et al., 2019. Each individual tumor cell is represented by a distinct color emphasizing the equivalent distribution throughout the projection. (B) Unsupervised clustering of data in (A) results in segregation of GBM cells into seven distinct clusters that contain representation from each of the 20 GBM. Three wild-type cell clusters were not included. (C) The data in (A) and (B) probed with the conserved 118-GS signature enriches only in cluster 2. (D) tSNE illustration of quiescent (GS) and proliferative cell clusters (P) in (A-C). (E) Heatmaps of the same data with mitotic and S-phase signatures identify clusters 5, 7, & 8 as proliferative. Scales are located at the top left. (F) Pie chart depicts relative proportions of cells enriched for the 118-GS signature (GS, green), proliferative signatures (P, red), and others (grey) in the integrated 20 GBM. (G-H) Violin plots depicting elevated (G) F3 receptor gene expression in GS cell clusters and (H) KI67 mRNA in the proliferative clusters. Horizontal black bars indicate mean values.

