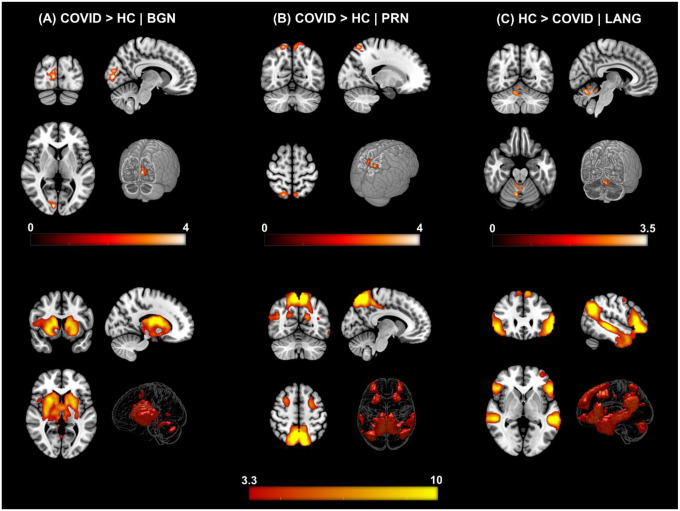
Figure 2. ΔFC | Functional Connectivity differences between COVID survivors and healthy controls.
[top row] (A) COVID > HC: Enhanced FC in COVID compared to HCs observed in the Basal Ganglia Network (BGN) network. Three orthogonal slices (left) along with a cut-to-depth volume rendered image to show the effects in the right Calc, Cu and LiG. The colorbar represents t – score values. Cluster information include - cluster peak: [9 −84 6], | cluster extent threshold, kE = 69 | cluster size = 69 voxels. (B) COVID > HC: Enhanced FC in COVID compared to HCs observed in the Precuneus (PRC) network, demonstrating a significant difference in FC in the bilateral SPL and PCu regions. Cluster information include - cluster peak: [21 −57 54], | cluster extent threshold, kE = 90 | cluster size = 90 voxels. (C) HC > COVID: Enhanced FC in HCs compared to COVID observed in the Language (LANG) network demonstrating significant difference in several vermal layers of the Cerebellum. Cluster information include - cluster peak: [9 −63 −24], | cluster extent threshold, kE = 57 | cluster size = 57 voxels. [bottom row] Corresponding group level ICA networks from which FC differences are shown on the top row. The colorbar represents z-scores.

