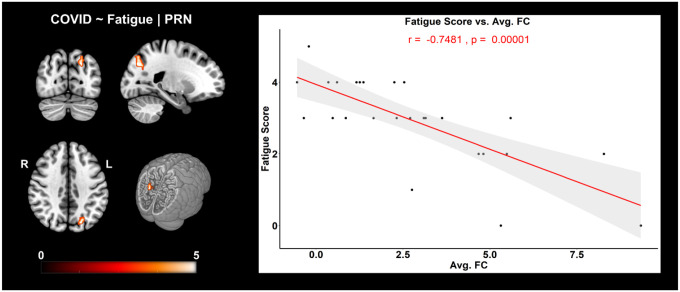
Figure 3. FC corr. Fatigue | COVID: Negative correlation of FC with self-reported fatigue scores in COVID individuals.
(left) For the PRN network, three orthogonal slices (left) along with a cut-to-depth volume rendered image showing regions from the Superior Parietal and Occipital Gyri that demonstrated significantly negative correlation with fatigue. The colorbar represents t-score values. (right) The graph shows the linear relationship of the average FC within the significant cluster and self-reported fatigue scores from COVID individuals. The x-axis represents the average FC (z-scores) from the cluster and the y-axis represents the fatigue scores. The shaded gray area represents the 95% confidence interval. The red line represents the least squares regression line of best fit. Cluster information include - cluster peak: [−21 −75 36], | cluster extent threshold, kE = 58 and cluster size = 58 voxels.

