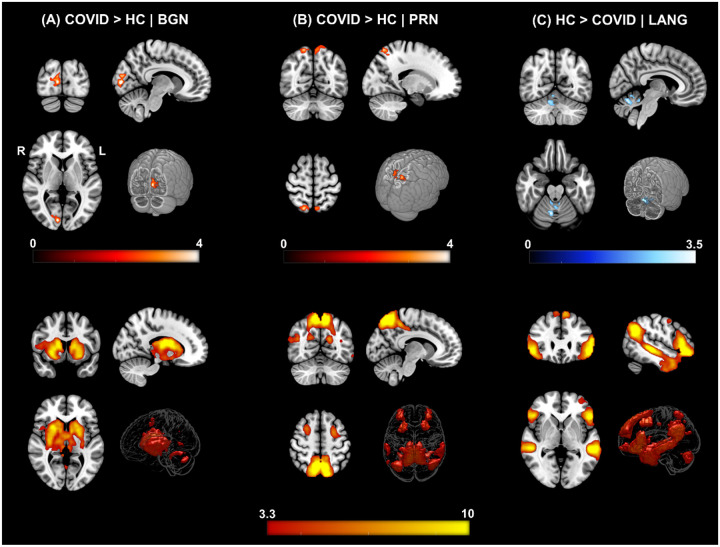
Figure 2. ΔFC | Functional Connectivity differences between COVID survivors and healthy controls.
[top row] (A) COVID > HC: Enhanced FC in COVID compared to HCs observed in the Basal Ganglia Network (BGN) network. Three orthogonal slices (left) along with a cut-to-depth volume rendered image to show the effects in the right Calc, Cu and LiG. The colorbar represents t – score values. Cluster information include - cluster peak: [9 −84 6], and cluster size = 69 voxels. (B) COVID > HC: Enhanced FC in COVID compared to HCs observed in the Precuneus (PRC) network, demonstrating a significant difference in FC in the bilateral SPL and PCu regions. Cluster information include - cluster peak: [21 −57 54] and cluster size = 90 voxels. Please note, enhanced FC among COVID survivors in both (A) and (B) is represented with a hot iron colormap and corresponding colorbar. (C) HC > COVID: Reduced FC in COVID compared to HC group observed in the Language (LANG) network demonstrating significant FC differences in several vermal layers of the Cerebellum. The electric blue colormap and corresponding colorbar are used to indicate that FC is reduced in the COVID group. Cluster information include - cluster peak: [9 −63 −24] and cluster size = 57 voxels. [bottom row] Corresponding group level ICA networks from which FC differences are shown on the top row. The colorbar represents z-scores.

