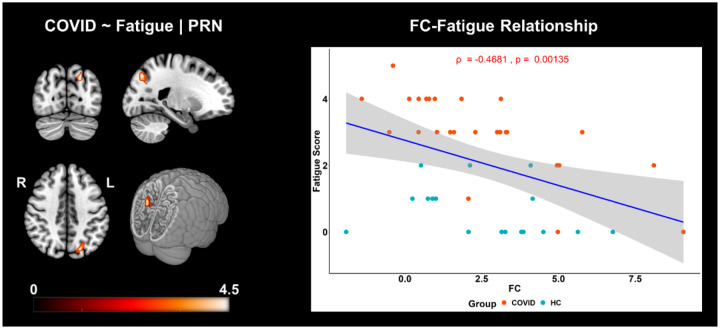
Figure 3. FC is negatively correlated with self-reported fatigue scores in COVID and HC individuals.
The three orthogonal slices on the left, shows the cluster withing the PRN network, along with a cut-to-depth volume rendered image consisting of Superior Parietal Lobule (SPL), Superior Occipital Gyrus (SOG), Angular Gyrus (AnG), Precuneus (PCu). This cluster demonstrated significantly negative correlation with fatigue. The colorbar represents tscore values. The cluster consisted of 46 voxels and the peak was located at MNI coordinates:[−21 −72 42]. The peak t-score of the cluster was, tpeak = 4.40, and corrected for multiple comparisons by controlling false discovery rates, at pfdr < 0.05. The graph on the right shows the linear relationship between FC within the significant cluster and self-reported fatigue scores across all groups. The x-axis represents the residuals plus the average FC (z-scores) across groups from the cluster and the y-axis represents the fatigue scores. The light pink dots represent the COVID group, and the cyan dots represent the HC group. The shaded gray area represents the 95% confidence interval. The blue line represents the least squares regression line of best fit.

