Figure 5.

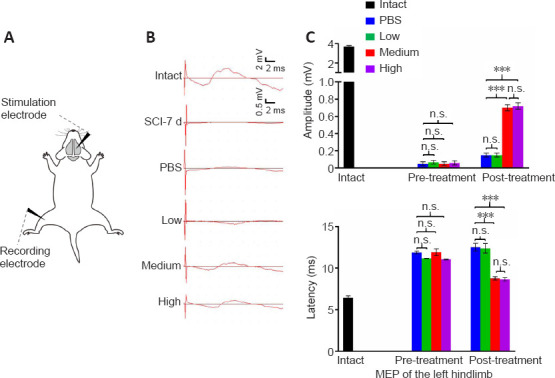
Both the medium and high dose treatments facilitate the transmission of descending inputs from the brain.
(A) Schematic diagrams of the motor evoked potential (MEP) assessments. Black arrowheads represent the stimulation and recording electrode. (B) Representative MEP recordings in rats with different treatments after SCI. Quantification and statistical analyses of amplitude (C) and latency period (D) of MEPs are shown. Intact: Normal rat; SCI-7d: subacute SCI; PBS: phosphate-buffered saline; Low: low dose (0.25 × 10⁶ cells/kg); Medium: medium dose (1 × 10⁶ cells/kg); High: high dose (4 × 10⁶ cells/kg). Data are presented as the mean ± SEM; n = 7/group; n.s.: not significant, ***P < 0.001 (one-way analysis of variance).
