. 2022 Jan 26;11:e73347. doi: 10.7554/eLife.73347

Figure 2. Changes of CarD levels in M.bovis BCG and M. tuberculosis H37Ra under host-like stress conditions.

(A, B) The protein levels of CarD in BCG and H37Ra strains, respectively, under distinct starvation conditions. (C, D) CarD protein levels at the different growth stages of BCG and H37Ra, respectively. (E) CarD protein levels in BCG and H37Ra under different pH conditions. (F) CarD protein levels in BCG and H37Ra under different oxygen availability conditions. For all panels, the number above each band of the Western blot represents their relative quantitative values, which are normalized with respect to their corresponding loading controls.

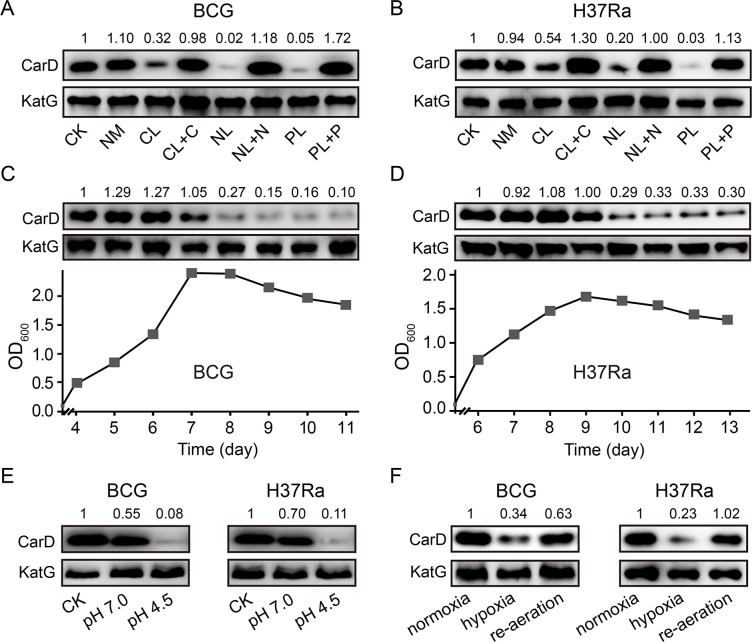
Figure 2.

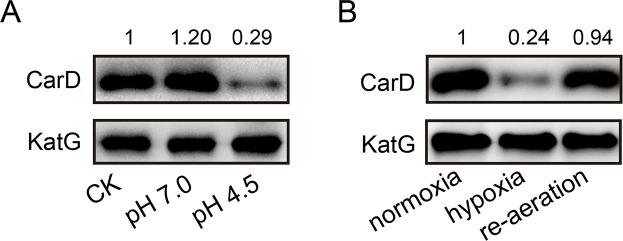
Figure 2—figure supplement 1. Changes of CarD levels in M. smegmatis under host-like stress conditions.

Figure 2—figure supplement 1.

(A) CarD protein levels in mc2155 under different pH conditions. CK indicates the untreated exponential cells; pH 7.0 and 4.5 indicate the exponential cells transferred into the media with corresponding pH values for 4 hr. (B) CarD protein levels in mc2155 under different oxygen availability conditions. The number above each band of the Western blot represents their relative quantitative values, which are normalized with respect to their corresponding loading controls.