. 2022 Jan 26;11:e73347. doi: 10.7554/eLife.73347

Figure 4. Identification and characterization of AscarD.

(A) Transcriptional landscapes of carD-ispD transcript and AscarD. Red and black lines represent exponential-phase cells, blue and green lines are from stationary-phase cells. Extensions of −1 and −2 represent two biological replicates. (B) Mapping of the transcriptional start site (TSS) of AscarD. The lower four-color chromatogram shows the results of Sanger sequencing, and the corresponding DNA sequence is displayed on the upper layer. The 5′-rapid amplification of cDNA ends (5′-RACE) adaptor sequence is framed by a black rectangle, and TSS is indicated by a black arrow. (C) Potential SigF-recognized −10 and −35 motifs upstream of the identified TSS are indicated with red rectangles. (D) AscarD transcript levels at different growth phases of mc2155 and ΔsigF strains were measured by qRT-PCR, normalized to sigA transcript levels, and expressed as fold change compared to levels of mc2155 cells at mid-exponential phase (MEP). Individual data for the three biological replicates are shown in the corresponding columns. (E) Promoter activities of ascarD in mc2155 and ΔsigF strains carrying a β-galactosidase-encoding reporter plasmid. Error bars indicate the standard deviation of three biological replicates.

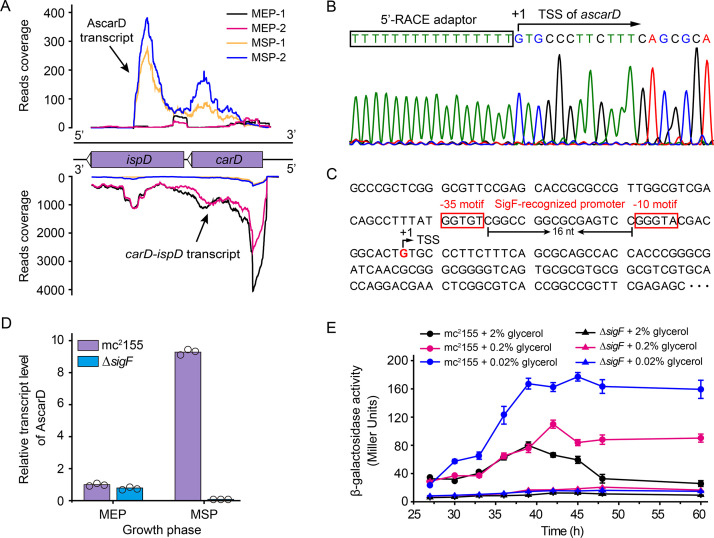
Figure 4—source data 1. AscarD transcript levels at different growth phases of mc2155 and ΔsigF strains (numerical data for Figure 4D).
Figure 4—source data 2. Promoter activities of ascarD in mc2155 and ΔsigF strains (numerical data for Figure 4E).

Figure 4.

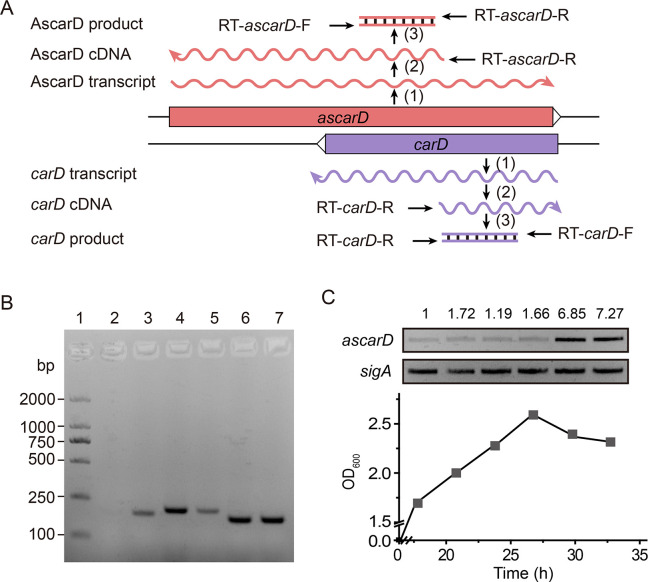
Figure 4—figure supplement 1. RT-PCR analysis of the transcriptional levels of ascarD and carD.

Figure 4—figure supplement 1.

(A) Schematic diagram of the strand-specific RT-PCR. Step (1) represents transcription of the ascarD and carD genes; step (2) represents ascarD and carD transcripts reverse transcribed into the corresponding cDNAs with RT-ascarD-R/RT-carD-R primers (Supplementary file 3); step (3) represents amplification of AscarD and carD cDNA with RT-ascarD-F/R or RT-carD-F/R primer pairs (Supplementary file 3), respectively. (B) The RT-PCR results at different growth phases. Lane one is the DL2000 ladder marker, lanes 2 and 3 show the ascarD RNA levels at mid-exponential phase (MEP) and mid-stationary phase (MSP), respectively; lanes 4 and 5 show carD RNA levels at MEP and MSP, respectively; lanes 6 and 7 show the RNA levels of internal reference gene sigA at MEP and MSP, respectively. (C) ascarD RNA levels throughout the growth phase as measured by RT-PCR; sigA was used as an internal reference gene. The number above each band of the RT-PCR represents their relative quantitative values, which are normalized with respect to their corresponding loading controls.