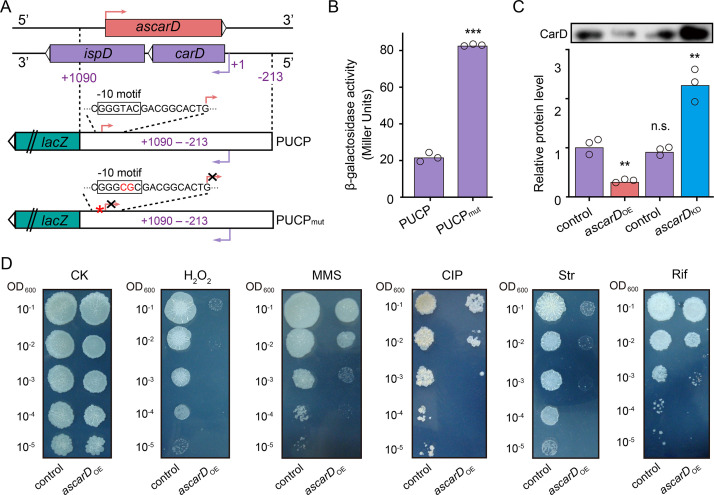
Figure 5. AscarD negatively regulates carD.
(A) A schematic diagram of PUCP and PUCPmut plasmids construction (see a detailed description in Experimental section). (B) β-Galactosidase activities of mc2155 strains transformed with PUCP or PUCPmut plasmid. Individual data for the three biological replicates are shown in the corresponding columns. (C) CarD protein levels in different strains. Mycobacterial cells were harvested at the mid-stationary phase (MSP). The upper part shows the Western blot with CarD levels, and the histogram below it shows the quantitative statistics of Western blot results. Statistical test was done using the Student's t-test, with ** indicating p-value <0.01, *** indicating p-value <0.001, and n.s. indicating p-value >0.05. (D) The tolerance of ascarDOE and control strains to oxidative stress, DNA damage, and antibiotic stimulation, respectively. Serially diluted bacterial suspensions were separately spotted onto normal 7H10 plate (CK) or plates containing 0.3 mM H2O2, 0.05% methanesulfonate (MMS), 0.2 μg/ml of ciprofloxacin (CIP), 0.1 μg/ml of streptomycin (Str), or 5 μg/ml of rifamycin (Rif), respectively.


