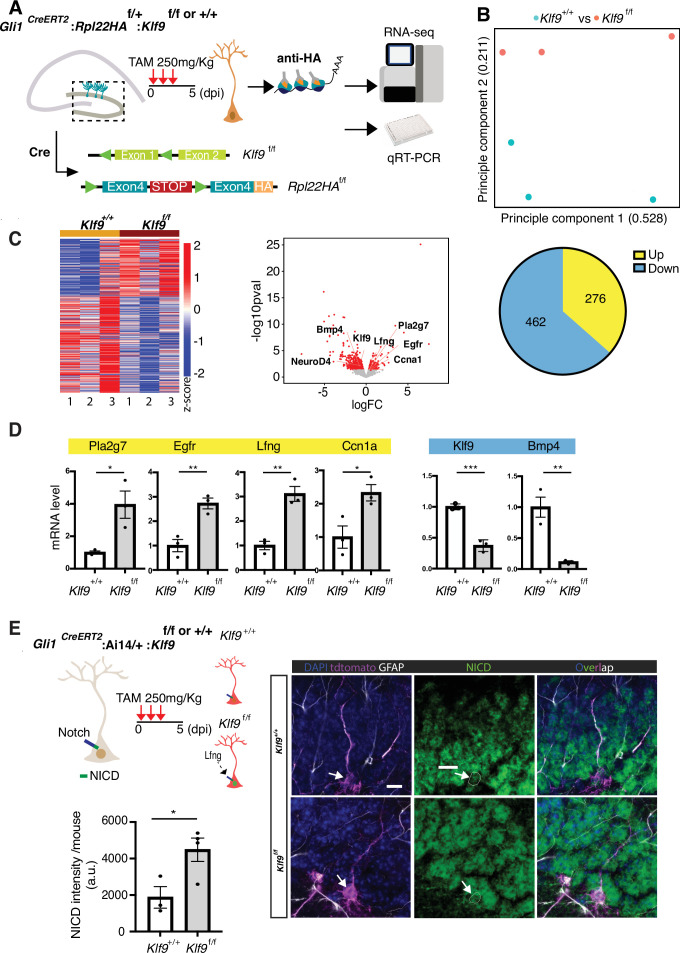
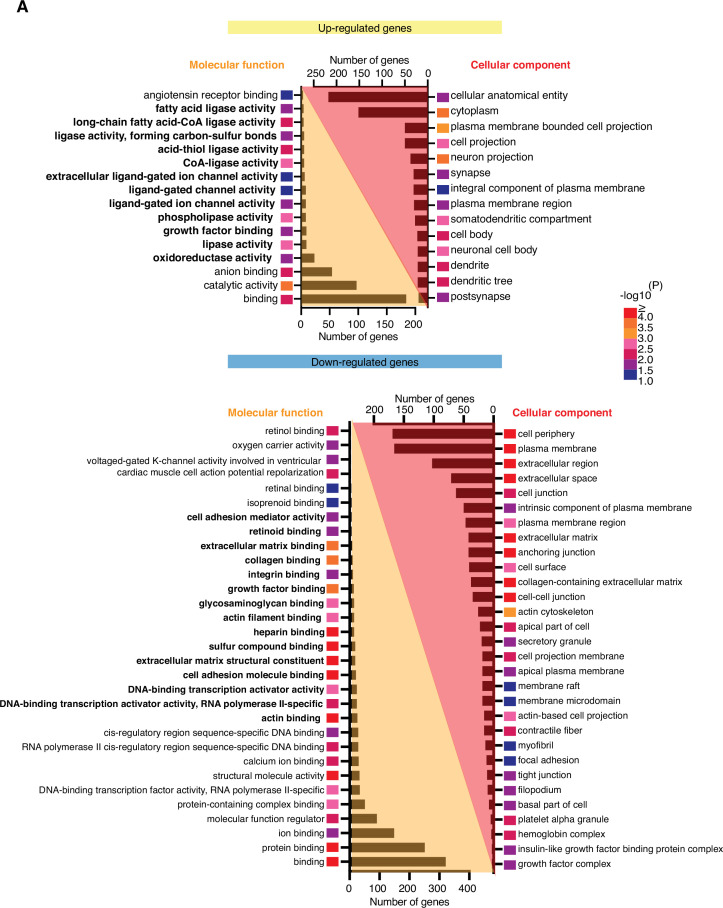
Figure 4. Kruppel-like factor 9 (Klf9) regulates genetic programs underlying radial-glial neural stem cell (RGL) expansion.
(A) Schematic of experimental workflow to biochemically isolate and sequence translated mRNAs from Gli1+ RGLs (Gli1CreERT2:Rpl22HAf/+:Klf9f/f or +/+ mice). n = 3 mice, 6 dentate gyri/sample, 3 samples per group. (B) Principal component analysis (PCA) plot of translational profiles of Gli1CreERT2-targeted Klf9+/+ or f/f RGLs. First two principal components are shown with the corresponding fractions of variance. (C) Left: heatmap of expression values for differentially expressed genes. Middle: volcano plot of statistical significance (−log10 p value) vs. magnitude of change (log2 of fold change) of gene expression. Differentially expressed genes are marked in red. Upregulated genes in Klf9f/f RGLs are on the right and downregulated genes in Klf9f/f RGLs are on the left. Right: pie chart of numbers of upregulated and downregulated genes in Gli1CreERT2-targeted Klf9f/f RGLs. (D) qRT-PCR on biochemically isolated mRNAs from Gli1CreERT2:Rpl22HAf/+:Klf9f/f or +/+ mice validating candidate differentially expressed genes. n = 3 samples, 6 dentate gyri/sample, 3 samples per group. (E) Immunostaining and quantification of Notch1 intracellular domain (NICD) in RGLs of Gli1CreERT2: Klf9f/f or +/+ mice. Deletion of Klf9 results in increased NICD levels in RGLs consistent with Lnfg-dependent potentiation of Notch1 signaling (Cartoon, top left). n = 3 mice/group. Data are represented as mean ± standard error of the mean (SEM). *p < 0.05, **p < 0.01, ***p < 0.001. Scale bar: 10 μm.


