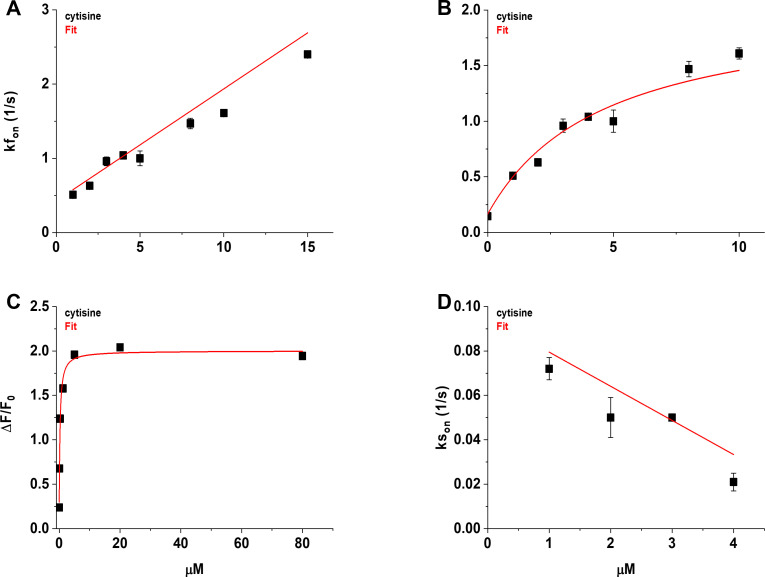
Appendix 2—figure 2. Concentration dependence of the fast (kfon) and slow rising rate constants (kson) of the cytisine response.
(A) The [Cytisine]-kfon relation was approximately linear between 1 and 15 µM cytisine. Symbols (filled squares) are the mean kfon for the individual cytisine concentrations tested (n = 7–10 areas per concentration, 29–40 cells). The red line is a regression line fit to the data using linear least-squares regression. See text for the values of the slope, intercept, and correlation coefficient. (B) The [Cytisine]-kfon relation for the kfon was more hyperbolic than linear between 0 and 10 µM cytisine. Red line is a fit to the sum of a hyperbolic, and constant, term using nonlinear least-squares regression. See text for fitted parameters. We used the mean slow decay rate constant (ksoff) of the cytisine response for the kfon at 0 µM cytisine (0.146 ± 0.006 s–1). (C) Concentration–response (CR) relation for the mean steady-state response to cytisine of iCytSnFR_PM sensors expressed in HeLa cells (n = 11 cells, see Figure 7B). Red line is the fit to the sum of a hyperbolic, and constant, terms using nonlinear least-squares regression. See text for fitted parameters. Symbols (filled squares) are the mean values for the final 10 s of the steady-state cytisine response. (D) The [Cytisine]-kson relation for 1–4 µM cytisine. Red line is a regression line fit to the data using linear least-squares regression. See text for the slope, intercept, and correlation coefficient. Symbols (filled squares) are the mean kson for the individual cytisine concentration tested (n = 8–10 areas per concentration, 31–38 cells). Error bars in panels (A–D) are ± SEM. Symbols obscure the bars at some concentrations in panels (A), (B), and (D), and all concentrations in panel (C).

