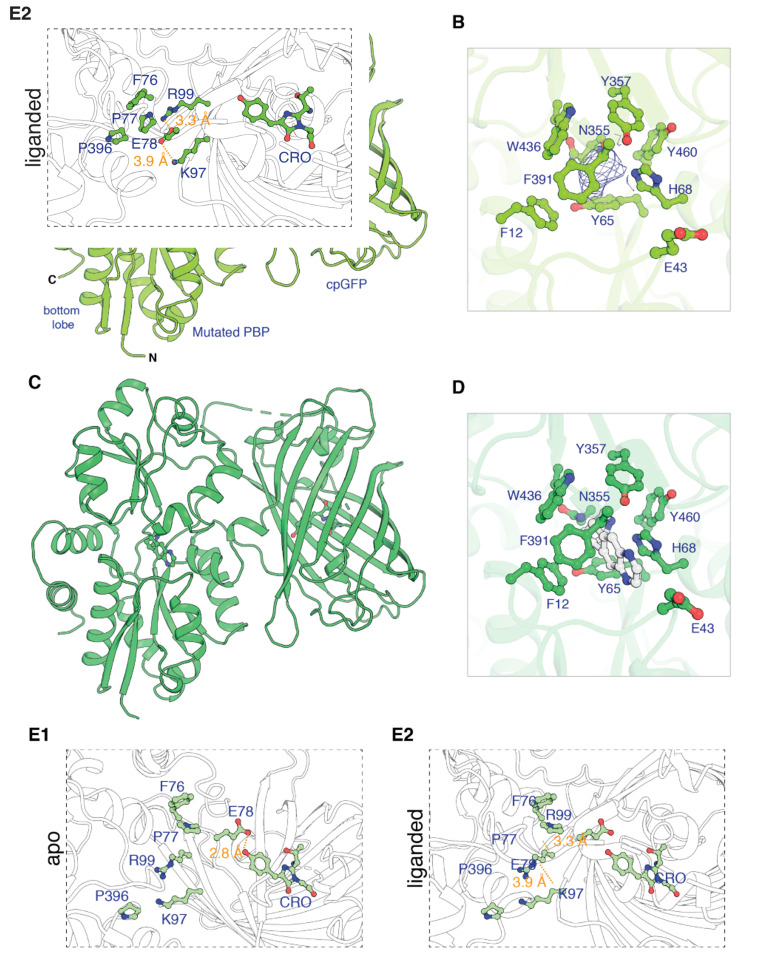
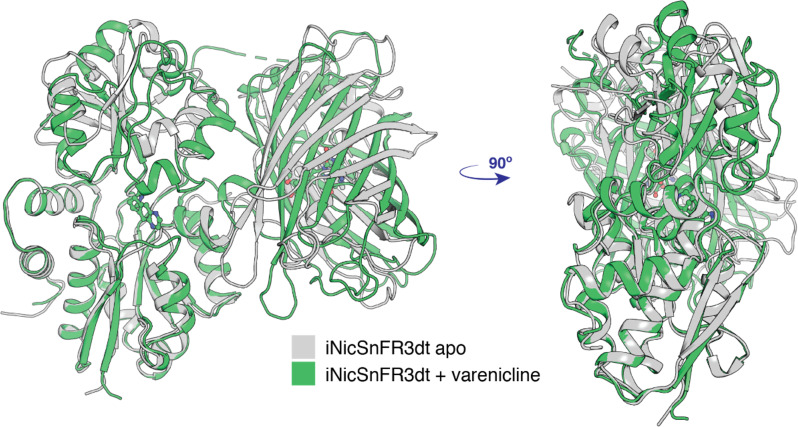
Figure 1. Apo and ligand-bound structures of iNicSnFR3adt (dt indicates that His6 and Myc tags have been removed to aid crystallization).
To form an intensity-based drug-sensing fluorescent reporter (iDrugSnFR), a circularly permuted GFP molecule, flanked by two 4-residue linking sequences, is inserted into a PBP at a position (77–78, in our numbering system) that changes backbone Φ-Ψ angles between the apo and liganded PBP. (A) Overall conformation of iNicSnFR3adt crystallized with nicotine; an electron density appears at the nicotine binding site (PDB 7S7U). (B) iNicSnFR3adt binding site residues. (C) Overall conformation of iNicSnFR3adt with varenicline bound (PDB 7S7T). (D) iNicSnFR3adt binding site with varenicline present. (E) Aspects of the PBP-Linker1-cpGFP interface, emphasizing contacts that change upon ligand binding. The Phe76-Pro77-Glu78 cluster (in Linker 1) lies 11–16 Å from position 43, which defines the outer rim of the ligand site (B); therefore, the cluster makes no direct contact with the ligand site. (E1) In the apo conformation, Glu78 acts as a candle snuffer that prevents fluorescence by the chromophore (PDB 7S7V). (E2) In the liganded conformation (PDB 7S7T), the Phe76-Pro77-Glu78 cluster moves Glu78 at least 14 Å away from the fluorophore. Pro77 is flanked by Phe76 and Pro396 (in the top lobe of the PBP moiety). The presumably deprotonated Glu78 forms salt bridges with Lys97 and Arg99, both facing outward on the β6 strand of the original GFP (within the original Phe165-Lys-Ile-Arg-His sequence).


