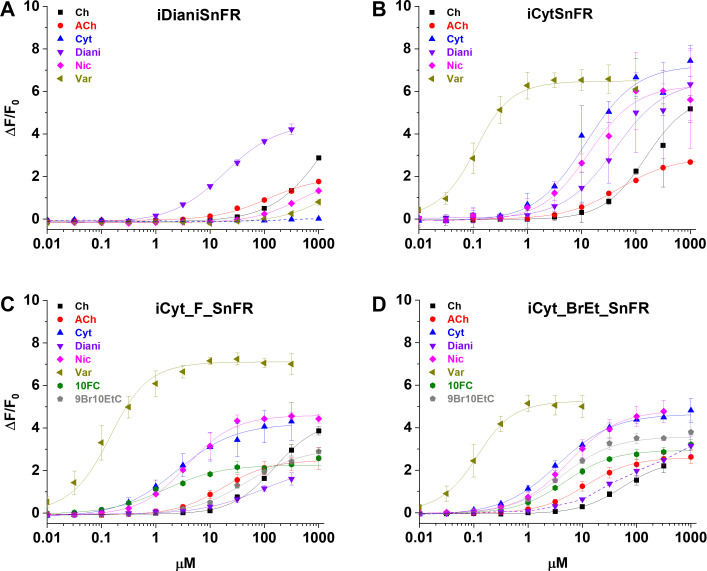
Figure 3. Dose–response relations of intensity-based drug-sensing fluorescent reporter (iDrugSnFR) protein versus a nicotinic agonist panel.
(A–D) Relevant EC50 values for each iDrugSnFR are listed in Table 2. Dashed lines indicate dose–response relations that did not approach saturation for the concentration ranges tested; therefore, EC50 and ∆Fmax/F0 could not be determined. (A) iDianiSnFR shows preference for dianicline, with some promiscuity for other nicotinic agonists. (B) iCytSnFR, (C) iCyt_F_SnFR, and (D) iCyt_BrEt_SnFR bind their drug partner, but also respond to other nicotinic agonists. Ch, choline; ACh, acetylcholine; Cyt, cytisine; Diani, dianicline; Nic, nicotine; Var, varenicline; 10FC, 10-fluorocytisine; 9Br10EtC, 9-bromo-10-ethylcytisine.


