. 2022 Jan 4;11:e74648. doi: 10.7554/eLife.74648

Figure 7. Nicotinic agonist intensity-based drug-sensing fluorescent reporter (iDrugSnFR) dose–response relations in HeLa cells.

(A–D) Each iDrugSnFR detects its drug partner at the plasma membrane (PM) and endoplasmic reticulum (ER) of HeLa cells at the concentrations sampled. BC, buffer control. SEM of data are indicated by semi-transparent shrouds around traces where trace width is exceeded. (A) iDianiSnFR detects dianicline with a return to baseline fluorescence between drug applications. (B) iCytSnFR detection at the PM returns to baseline fluorescence between applications, while detection at the ER shows incomplete wash-in and washout. (C) iCyt_F_SnFR fluorescence response to the presence of 10-fluorocytisine in the ER also shows an incomplete washout between applications. (D) iCyt_BrEt_SnFR detects 9-bromo-10-ethylcytisine with wash-in and washout fluorescence similar to the pattern seen in iDianiSnFR.

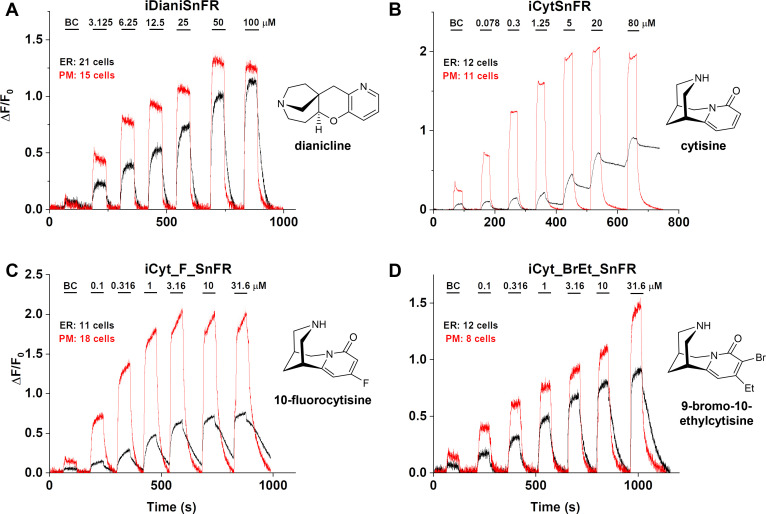
Figure 7.

Figure 7—figure supplement 1. Traces of fluorescence responses during time-resolved low-concentration dose–response relations for nicotinic agonists in HeLa cells.

Figure 7—figure supplement 1.

BC, buffer control. SEM of data are indicated by semi-transparent shrouds around traces where trace width is exceeded. Cyt (cytisine) in cells expressing iCytSnFR_ER (A) or iCytSnFR_PM (B); 10FC (10-fluorocytisine) in cells expressing iCyt_F_SnFR_ER (A) or iCyt_F_SnFR_PM (B); 9Br10EtC (9-bromo-10-ethylcytisine) in cells expressing iCyt_BrEt_SnFR_ER (A) or iCyt_BrEt_SnFR_PM (B). Relatively long (300 s) washout periods between drug applications allowed a return to baseline fluorescence for the (A) endoplasmic reticulum (ER) and (B) plasma membrane (PM). (C) A zoomed-in exemplar comparison of the ER and PM for a pulse of 1 µM 10-fluorocytisine shows a distinct lag in the decrease of the fluorescent signal in the ER as compared to the PM.
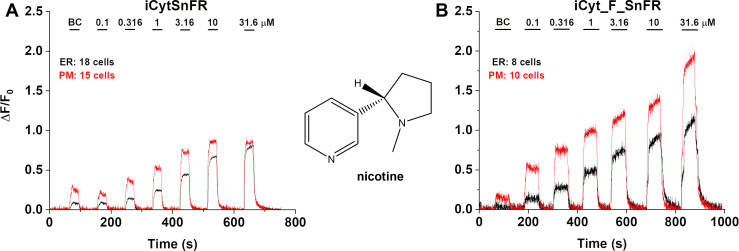
Figure 7—figure supplement 2. Dose–response relations for iCytSnFR and iCyt_F_SnFR against nicotine in HeLa cells.

Figure 7—figure supplement 2.

BC, buffer control. SEM of data are indicated by semi-transparent shrouds around traces where trace width is exceeded. (A) iCytSnFR and (B) iCyt_F_SnFR detect nicotine at both the plasma membrane (PM) and endoplasmic reticulum (ER). Nicotine enters and exits the ER rapidly over seconds, a direct contrast to the behavior of cytisine and 10-fluorocytisine as detected by their intensity-based drug-sensing fluorescent reporter (iDrugSnFR) partners.
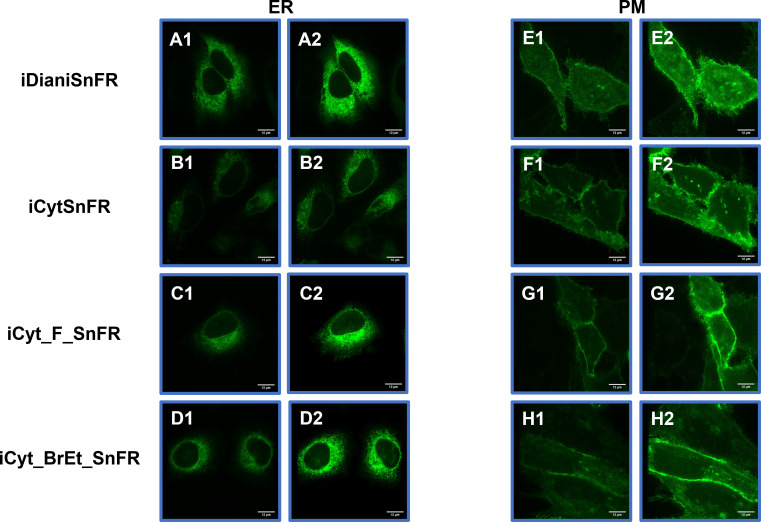
Figure 7—figure supplement 3. Spinning disk laser scanning confocal inverted microscope images of nicotinic agonist intensity-based drug-sensing fluorescent reporters (iDrugSnFRs) in HeLa cells.

Figure 7—figure supplement 3.

Endoplasmic reticulum (ER)-targeted constructs of iDianiSnFR, iCytSnFR, iCyt_F_SnFR, and iCyt_BrEt_SnFR are shown before (A1–D1) and during (A2–D2) exposure to each drug partner. ER-targeted iDrugSnFRs show the reticulated ER and dark ovals corresponding to the nucleus. Plasma membrane (PM)-targeted constructs of the same iDrugSnFRs are shown before (E1–H1) and after (E2–H2) drug introduction. Localization to the PM is robust, with some minimal puncta that may represent inclusion bodies or internal transport.