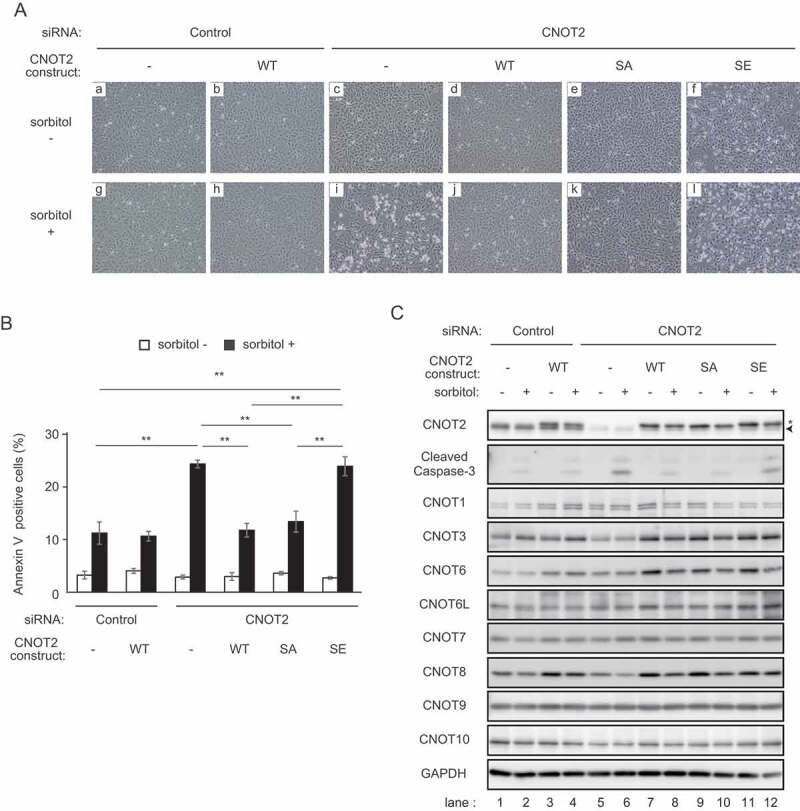
Figure 3.

Phospho-mimic CNOT2 renders cells sensitive to osmotic stress.
(A) HeLa cells were infected with retrovirus expressing mock (-) or the indicated CNOT2 constructs (WT, SA, or SE). They were subsequently transfected with control siRNA or siRNA against CNOT2. SiRNA-transfected cells were treated with (+, g-l) or without (-, a-f) sorbitol for 6 h. Representative images of the cells are shown. Round and floating cells increased in number after sorbitol treatment in CNOT2 siRNA-transfected cells that were infected with mock (-) and CNOT2 SE retrovirus (compare panels c and i, f and l). (B) Annexin V staining was performed to quantify the number of apoptotic cells in (A) (see the Materials and Methods). The graph shows percentages of annexin V-stained cells. Values represent means ± standard errors of means (n = 3). One-way ANOVA with Bonferroni/Dunnett’s multiple comparisons post hoc test was performed. **P < 0.01. (C) Lysates were prepared from HeLa cells treated as in (A) (sorbitol treatment for 6 h) and analysed by immunoblot. Lower bands indicated by an arrowhead and upper bands indicated by an asterisk correspond to endogenous CNOT2 and exogenously expressed HA-tagged CNOT2, respectively (top panel, please also see Fig. 4A).
