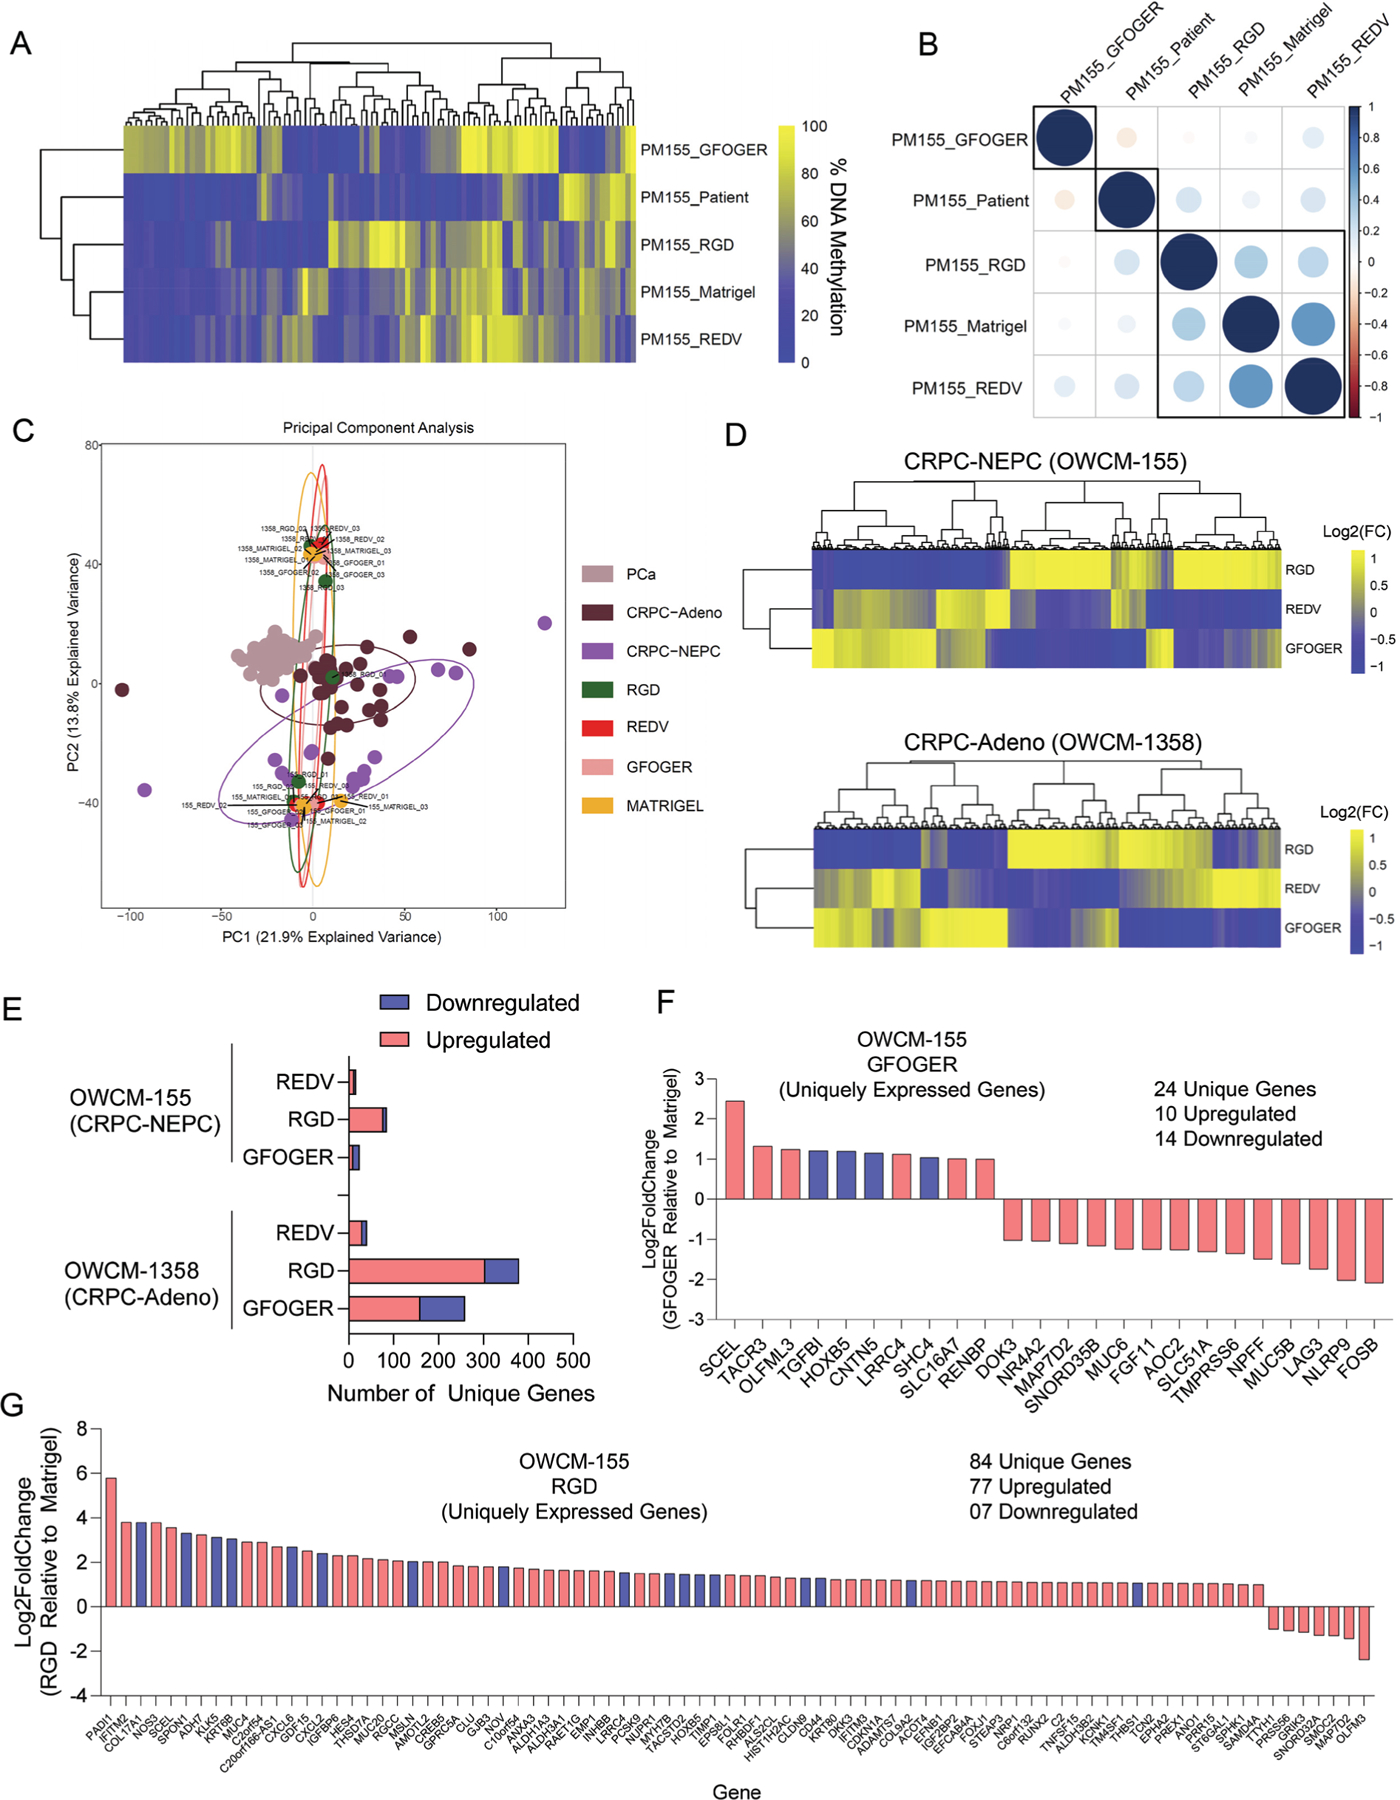
Figure 4.

ECM-dependent differential DNA methylation and gene mobilization in Peg-4MAL hydrogel-based prostate cancer organoids. A) Heirchial clustering heatmap of the DNA methylation levels of the top 100 most variable promoters of methylation. Genes were ranked based on the standard deviation of promoter methylation across all the samples. Data represent pooled cells from 24 PEG-4MAL hydrogel-based organoids and 30 Matrigel organoids. B) Pearson correlation of methylation profiles between patient samples and organoids. The numbers represent pair-wise Pearson correlation coefficients between each pair. Promoter methylation was calculated by averaging the methylation levels of inside CpGs. C) PCA for gene expression in organoids compared to primary patient tumors CRPC-NEPC, CRPC-Adeno, and localized prostate adenocarcinoma PCa. D) Heatmap of differentially expressed genes in CRPC-NEPC OWCM-155 and CRPC-Adeno OWCM-1358 cultured across GFOGER, RGD, and REDV-functionalized PEG-4MAL hydrogel and normalized to Matrigel. Data represent an average of 3 organoids per condition. Yellow (high), blue (low). E) Number of differentially expressed unique genes in OWCM-155 and OWCM-1358 tumors grown in PEG-4MAL organoids relative to Matrigel. Data represent an average of 3 organoids per condition. F) Unique genes expressed by OWCM-155 tumors grown in GFOGER hydrogels. Blue indicates genes that are related to cell adhesion or cytoskeletal pathways. G) Unique genes expressed by OWCM-155 tumors grown in RGD hydrogels. The blue bars indicate genes that are related to cell adhesion or cytoskeletal pathways. The data represent an average of 3 organoids per condition.
