
Figure 6.
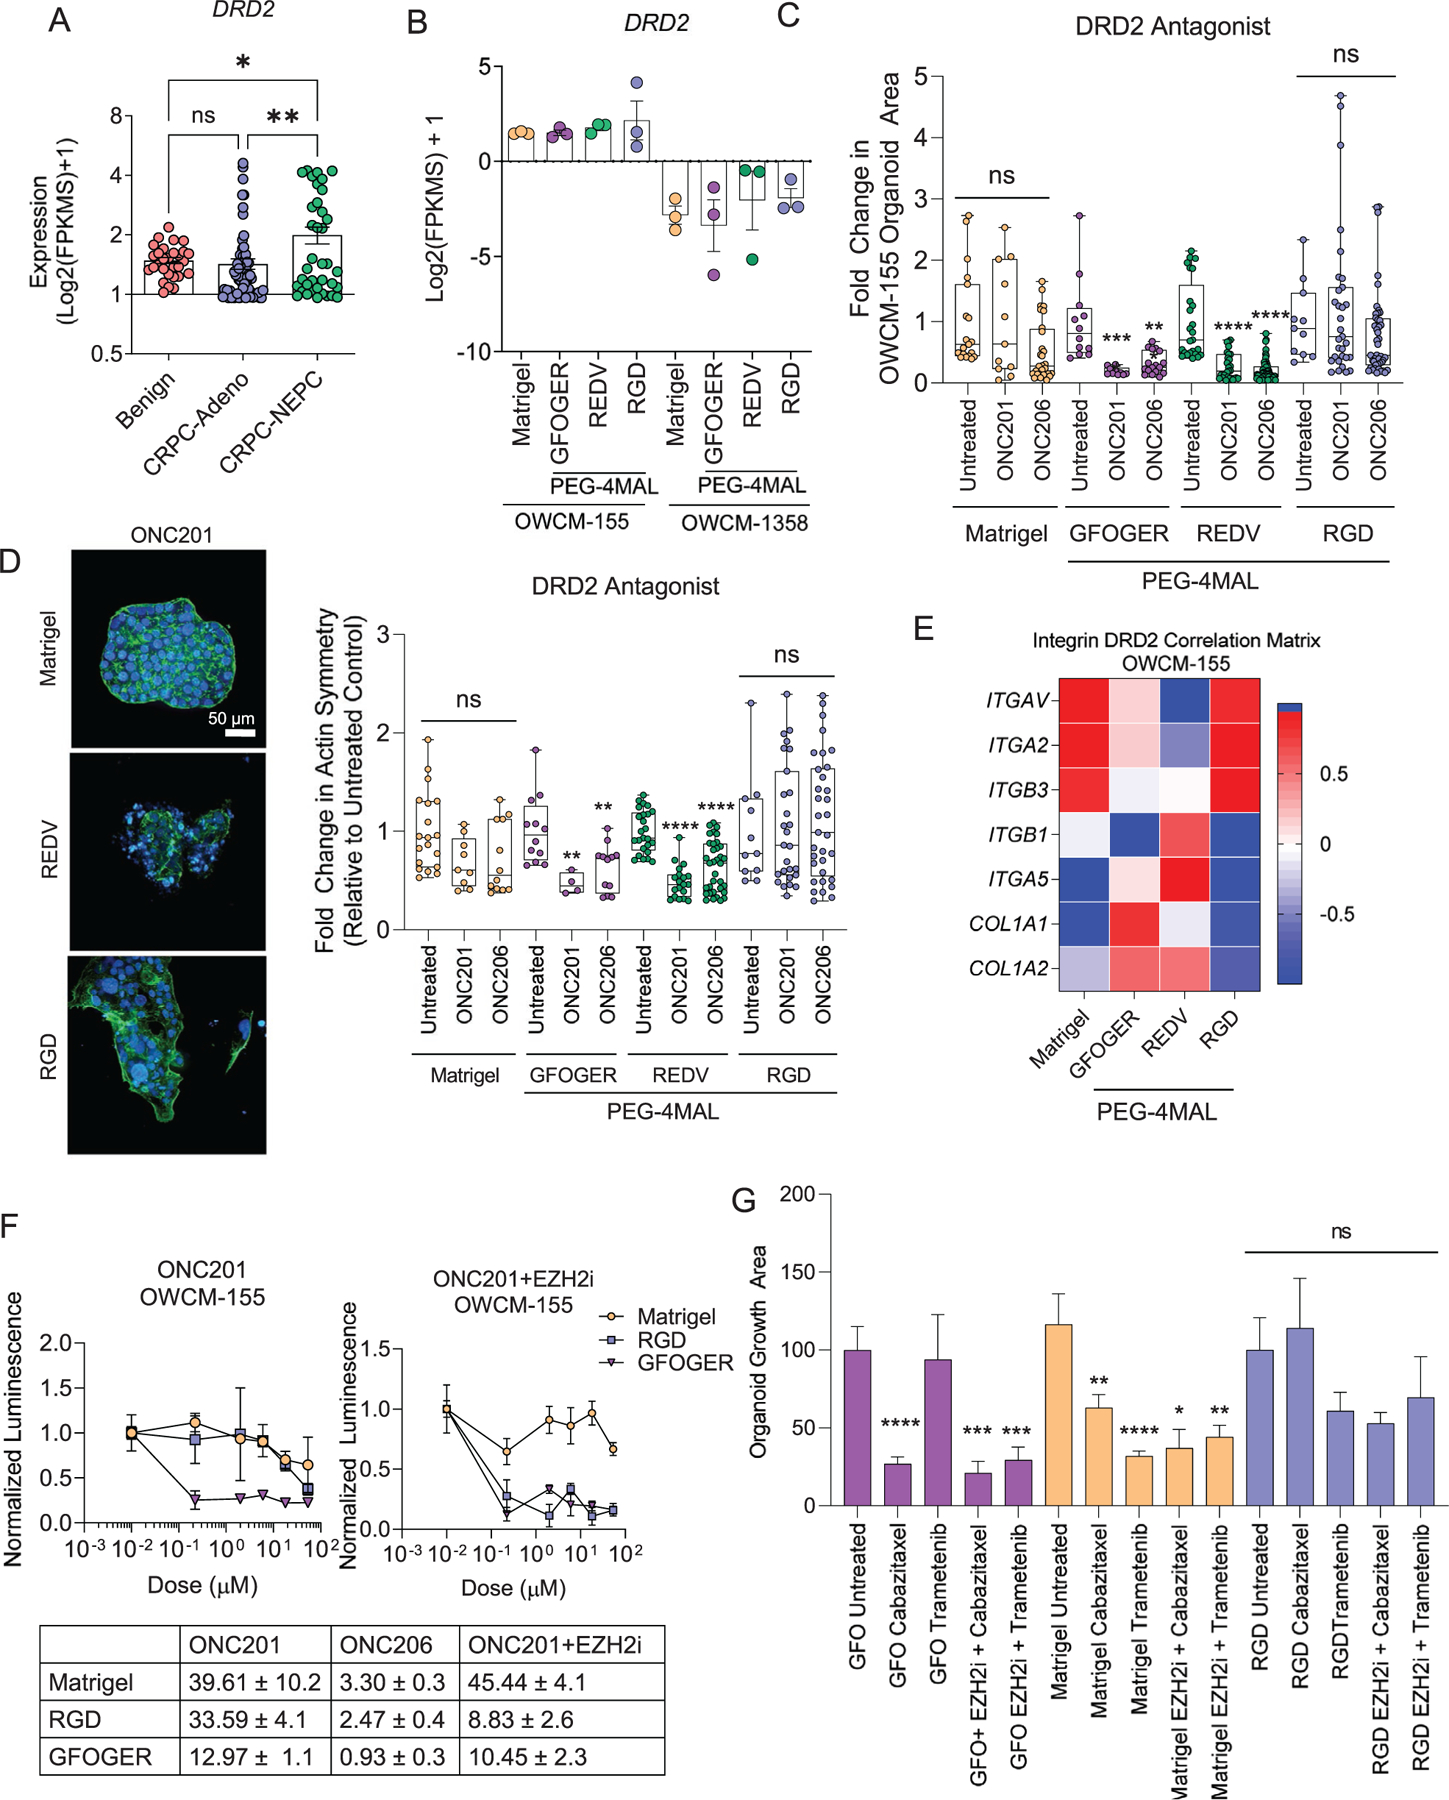
Dopamine Receptor 2 as a single agent and combinatorial therapeutic target in CRPC-NEPC. A) Transcriptomic expression of Dopamine Receptor 2 (DRD2) gene across disease progression from the patient cohort (n = 31 Benign, n = 74 CRPC-Adeno, n = 37 CRPC-NEPC). A one-way ANOVA compared all groups with a posthoc Tukey’s test with ****p < 0.0001. B) DRD2 gene expression in PEG-4MAL and Matrigel prostate organoids (n = 3 per condition). C) Fold change in the organoid growth area, determined by high-content imaging of cultures grown under DRD2 inhibition conditions. A one-way ANOVA, with posthoc Tukey’s test with **p < 0.01, ***p < 0.001, and ****p < 0.0001 was used for comparison. D) Left, representative high-content imaging of Matrigel and PEG-4MAL organoid architecture, cultured with ONC201. (DAPI: blue, Actin: green). Right, quantification of actin symmetry of organoids under DRD2 antagonist treatment. Treated groups were compared to untreated controls by a one-way ANOVA, with posthoc Tukey’s test with **p < 0.01, ***p < 0.001, and ***p < 0.0001. E) Correlation heatmap of transcriptomic expression of DRD2 signal with genes differentially expressed by synthetic organoids (n = 3 per condition). F) Drug response curves for ONC201 treatment with and without EZH2 inhibitor, GSK343 (n = 5 per condition). Each growth condition was normalized to untreated conditions for that group. G) Drug response for Cabazitaxel and Trametinib single-agent treatment and with the EZH2 inhibitor, GSK343 (n = 5 per condition). A one-way ANOVA, with posthoc Tukey’s test with **p < 0.01, ***p < 0.001, and ****p < 0.0001 was used for comparison.