
Figure 4.
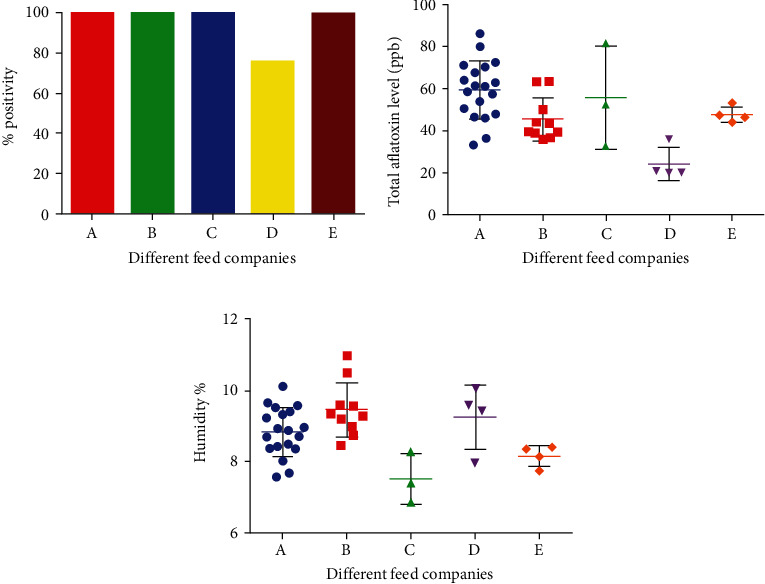
(a) Frequency, (b) total aflatoxin level, and (c) moisture content in poultry feed of different companies. Results shown in (a) are represented in percentages, whereas results in (b, c) are shown as mean ± SEM of parts per billion and percent humidity of 40 samples tested.