
Fig. 6.
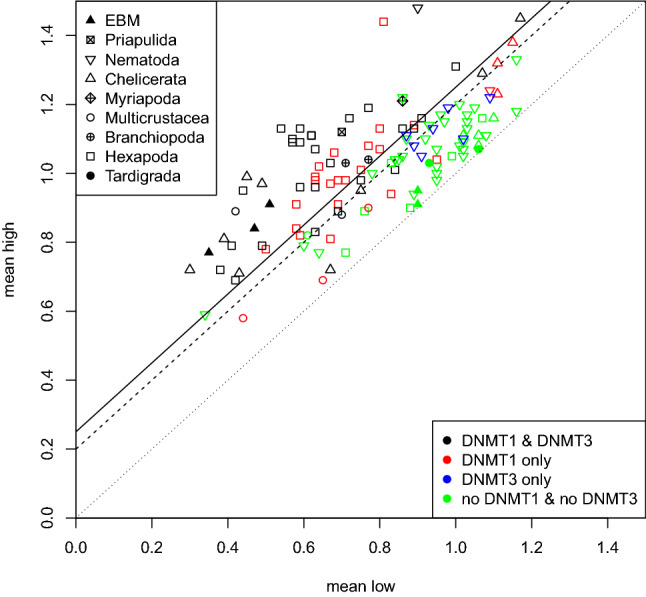
Each point shows one species analyzed by Gaussian Mixture Modeling (GMM). The axes are the means of the two components. The taxonomic group is indicated by the style of the point. The color represents if both, DNMT1 and DNMT3 (green), have been found in the species, only DNMT1 (red), only DNMT3 (black) or neither one nor the other (blue). The diagonal lines indicate the distance between the mean of both GMM components. The dotted line indicates a distance of , the dashed one and the solid line (selected threshold). ’EBM’ stands for ’Early-branching metazoa’, i.e., Porifera, Placozoa and Cnidaria (Color figure online)