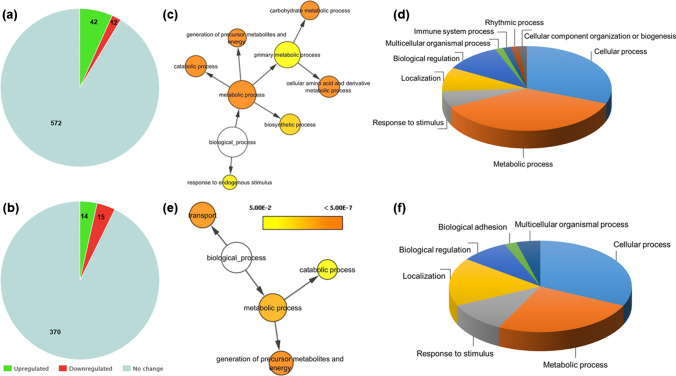
Fig. 4.
Label-free quantitative proteomic analysis of Pex11α knockout (KO; Pex11α−/−) and wild type (WT; Pex11α+/+) control mice. Pie charts depict the number of quantified and differentially abundant proteins in a liver and b heart tissue homogenates. Biological processes of the differentially abundant proteins in (c and d) liver and (e and f) heart analyzed by Cytoscape and PANTHER. Color scale indicates the significance, and size of the circle indicates the number of proteins involved

