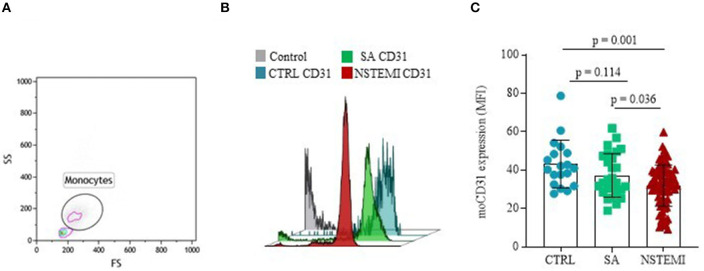
Figure 2.
CD31 expression on monocytes. Graphs showing the surface protein expression of CD31 on CD14+ monocytes assessed by flow-cytometry (mean ± SD) in basal conditions. (A) Representative flow cytometry forward vs. side scatter plot of monocyte subset; (B) Representative flow cytometry overlay plot; (C) Data analysis of moCD31 surface protein expression between the three groups (CTRL, Control individuals; FS, Forward Scatter; MFI, Median Fluorescence Intensity; moCD31, monocyte CD31; NSTEMI, Non-ST-Elevation Myocardial Infarction; SA, Patients with Stable Angina; SD, Standard Deviation; and SS, Side Scatter).

