Figure 5.
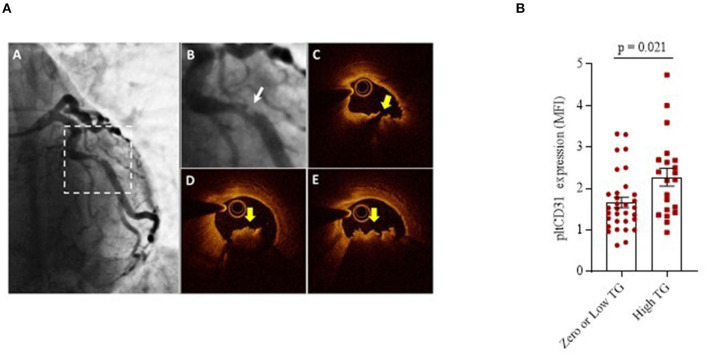
Platelet CD31 expression and Thrombus-Grade evaluation. (A) Representative angiographic and OCT images of a plaque. (A) Coronary angiogram of the left coronary artery showing a culprit lesion on the left circumflex (dotted squared selection); (B) Magnification of the angiogram showing a complex culprit lesion with a thrombus grade 3 and a scalloped profile (Ambrose type II eccentric); (C) Corresponding OCT cross-sectional image showing a lipid-rich plaque with a disrupted fibrous cap (yellow arrow); (D,E) Adjacent OCT cross-sections showing a large thrombus (yellow arrows). (B) pltCD31 surface protein expression within NSTEMI group showing the differences between patients with zero/low and high thrombus grade at the site of culprit stenosis. Data were assessed by flow-cytometry (mean ± SD), in basal conditions (MFI, Median Fluorescence Intensity; pltCD31, platelet CD31; SD, Standard Deviation; and TG, Thrombus Grade).

