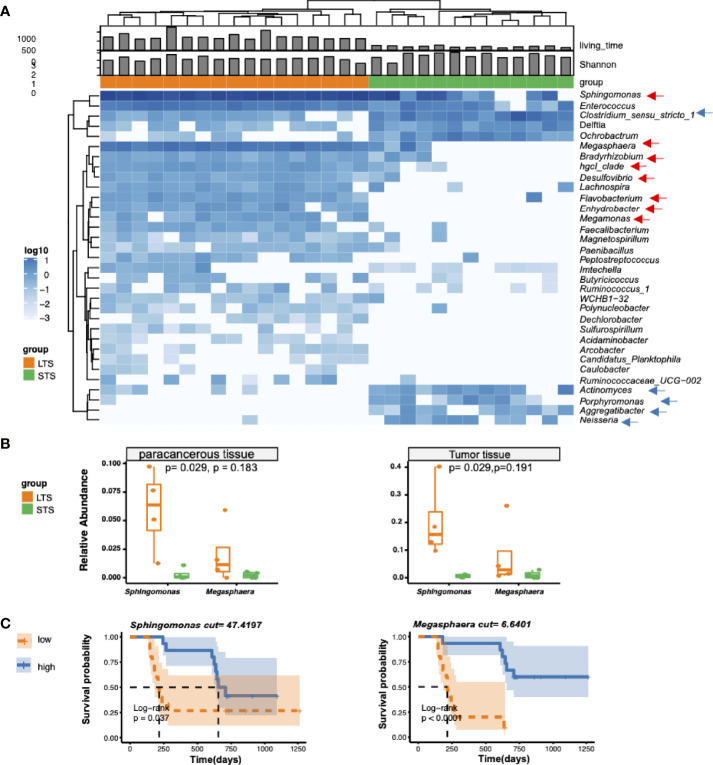
Figure 2.
Differential genera and survival analysis. (A) Heatmap of differentially bacterial abundant features at the genus level. Blue color represents the highest abundance, lighter blue color represents intermediate abundance, and white color represents lower abundance. Three taxa enriched in LTS samples, and 4 taxa enriched in STS samples (p<=0.001 and |R2|>=0.7) are presented. (B) Validation of the presence of Sphingomonas and Megasphaera in tumor tissue from LTS and STS by qPCR. 2-ΔΔCT method was used to calculate the relative abundance. t-test was used for statistical significance analysis. (C) Kaplan-Meier estimates for survival probability with high abundance versus low abundance of different microbiome in STS and LTS patients.

