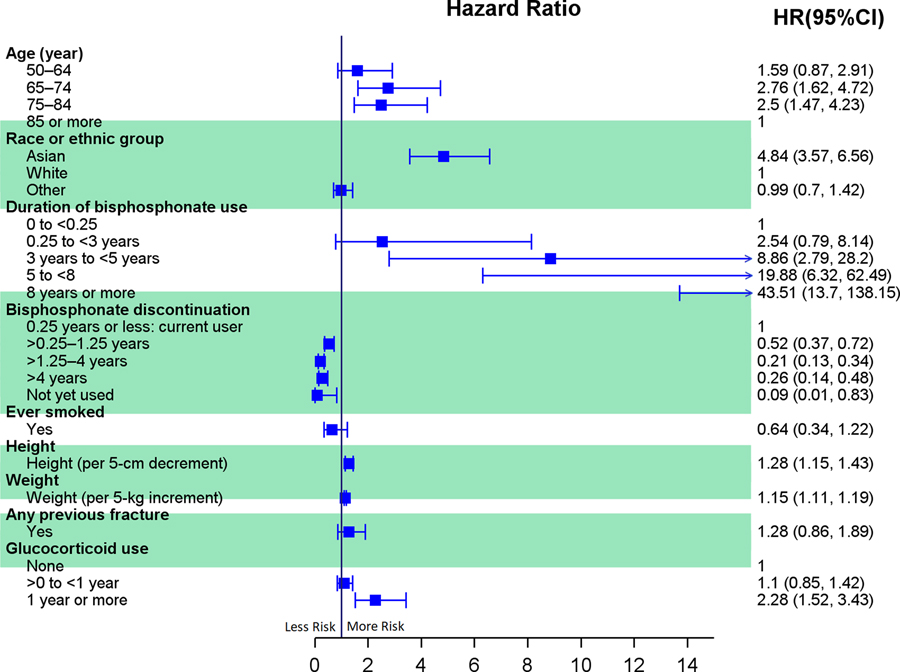
Figure 2.
The forest plot of risk factors associated with risk of atypical femur fracture. HRs and 95% CIs are from a model adjusted for these variables. The arrow shows the upper limit of the confidence interval spread further than the specified hazard ratio range (0 to 15). HR, hazard ratio; CI, confidence interval. 12

