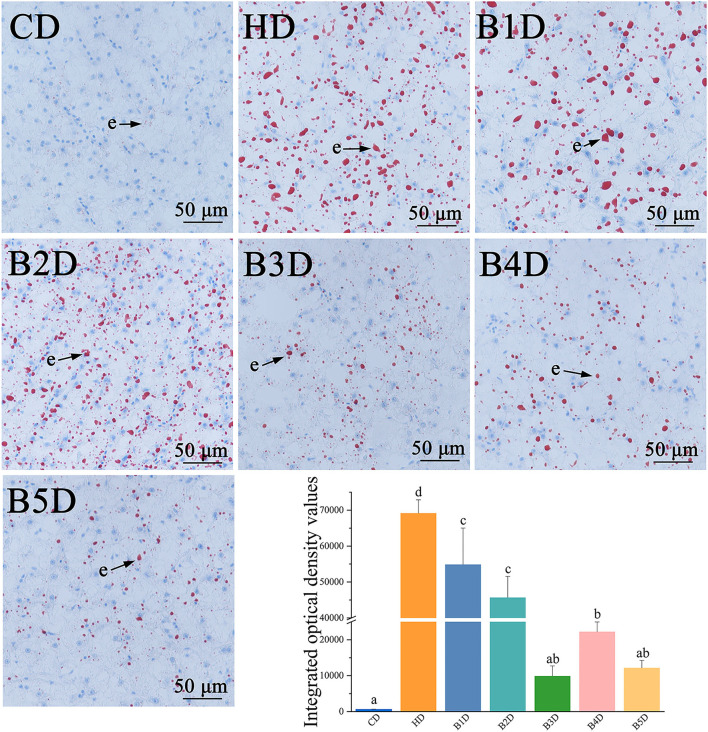
Figure 2.
Photomicrographs of representative oil red O-stained histological liver sections of fish from HD and BD groups. e: lipid droplets are stained red and analyzed by integrated optical density (n = 4), and the nuclei are stained blue in oil-red O-stained sections. Values are presented as means with SD, where significant (p < 0.05) differences between groups are indicated by different letters.

