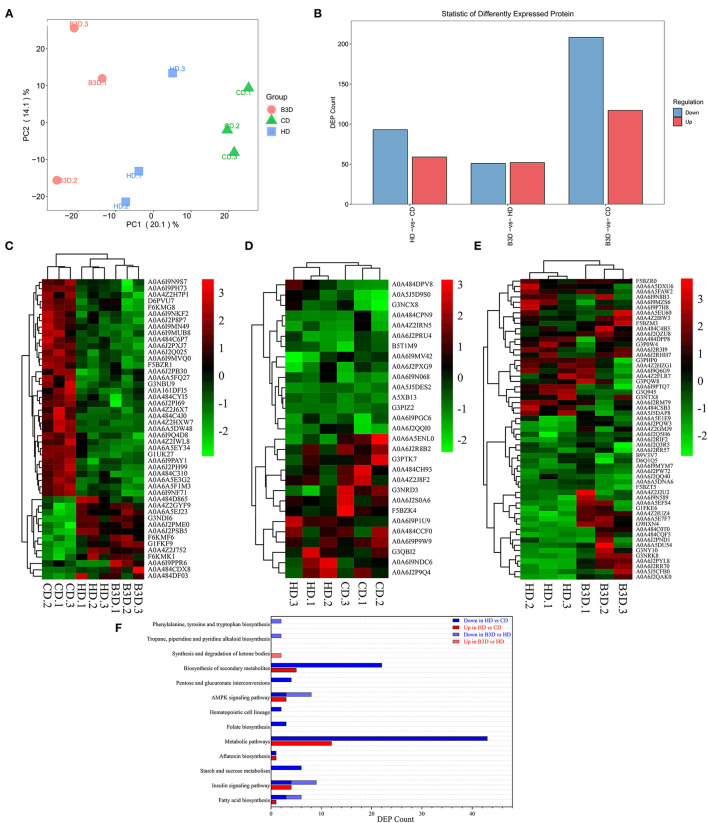
Figure 5.
Further analyses of proteomic profiles of liver samples in CD, HD, and B3D groups. (A) the largest two weight-scores of principal components (PC) in the protein composition: PC1 explained 20.1% of the total variability of the data, and PC2 explained 14.1% (n = 3). (B) the amount of down or upregulated DEPs in the HD vs. CD, B3D vs. HD, and B3D vs. CD group comparisons. Proteins with a fold change larger than 1.5 and a P-value below 0.05 (using the Benjamini-Hochberg multiple testing correction test) were designated as DEPs. (C) The heatmap of DEPs in the HD group (compared to the CD group) and B3D group (compared to the HD group). (D) The heatmap of DEPs in the HD group (compared to the CD group). (E) the heatmap of DEPs in the B3D group (compared to the HD group). (F) the amount of down or upregulated DEPs in the KEGG enrichment analysis of HD vs. CD and B3D vs. HD group comparisons.

