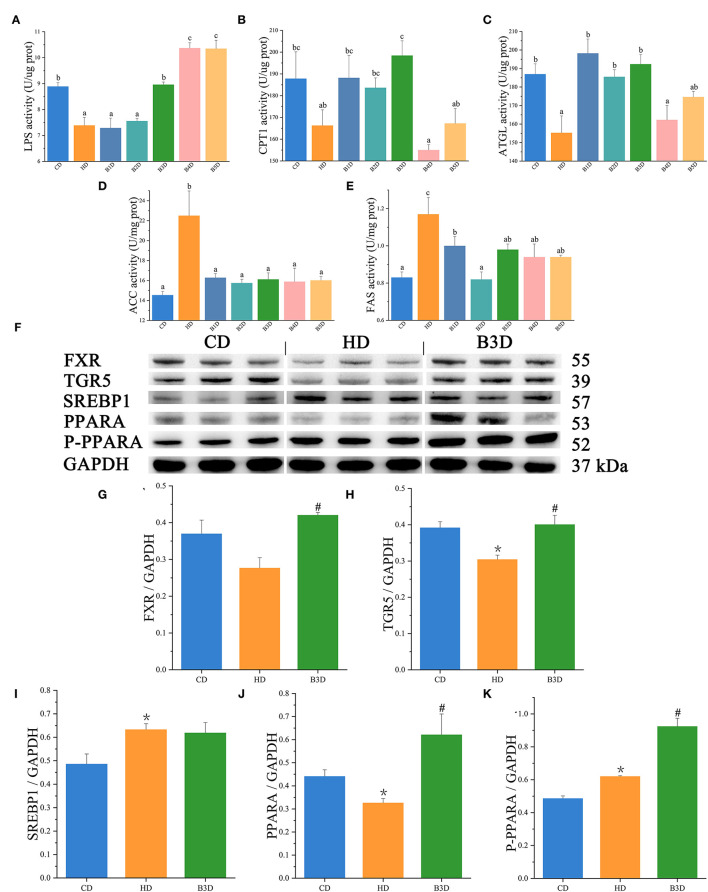
Figure 6.
The activities of enzymes and expression of proteins in the liver samples. (A–E) the activities of LPS (lipase), CPT1 (carnitine palmitoyltransferase 1), ATGL (triglyceride lipase), ACC (acetyl-CoA carboxylase), and FAS (fatty acid synthase) in fish (n = 6). (F) the Western Blot analysis of SREBP1 (sterol responsive element binding protein 1), PPARA (peroxisome proliferator-activated receptor alpha), P-PPARA, and GAPDH in the liver (n = 3). (G–K) the relative quantification of FXR, TGR5, SREBP1, PPARA, and P-PPARA proteins normalized to the GAPDH level (n = 3). Values are presented as means with SD, where significant (p < 0.05) differences between groups are indicated by different letters. “*” indicates significant (p < 0.05) differences in the HD group (compared to the CD group), and “#” indicates significant (p < 0.05) differences in the B3D group (compared to the HD group).

