Figure.

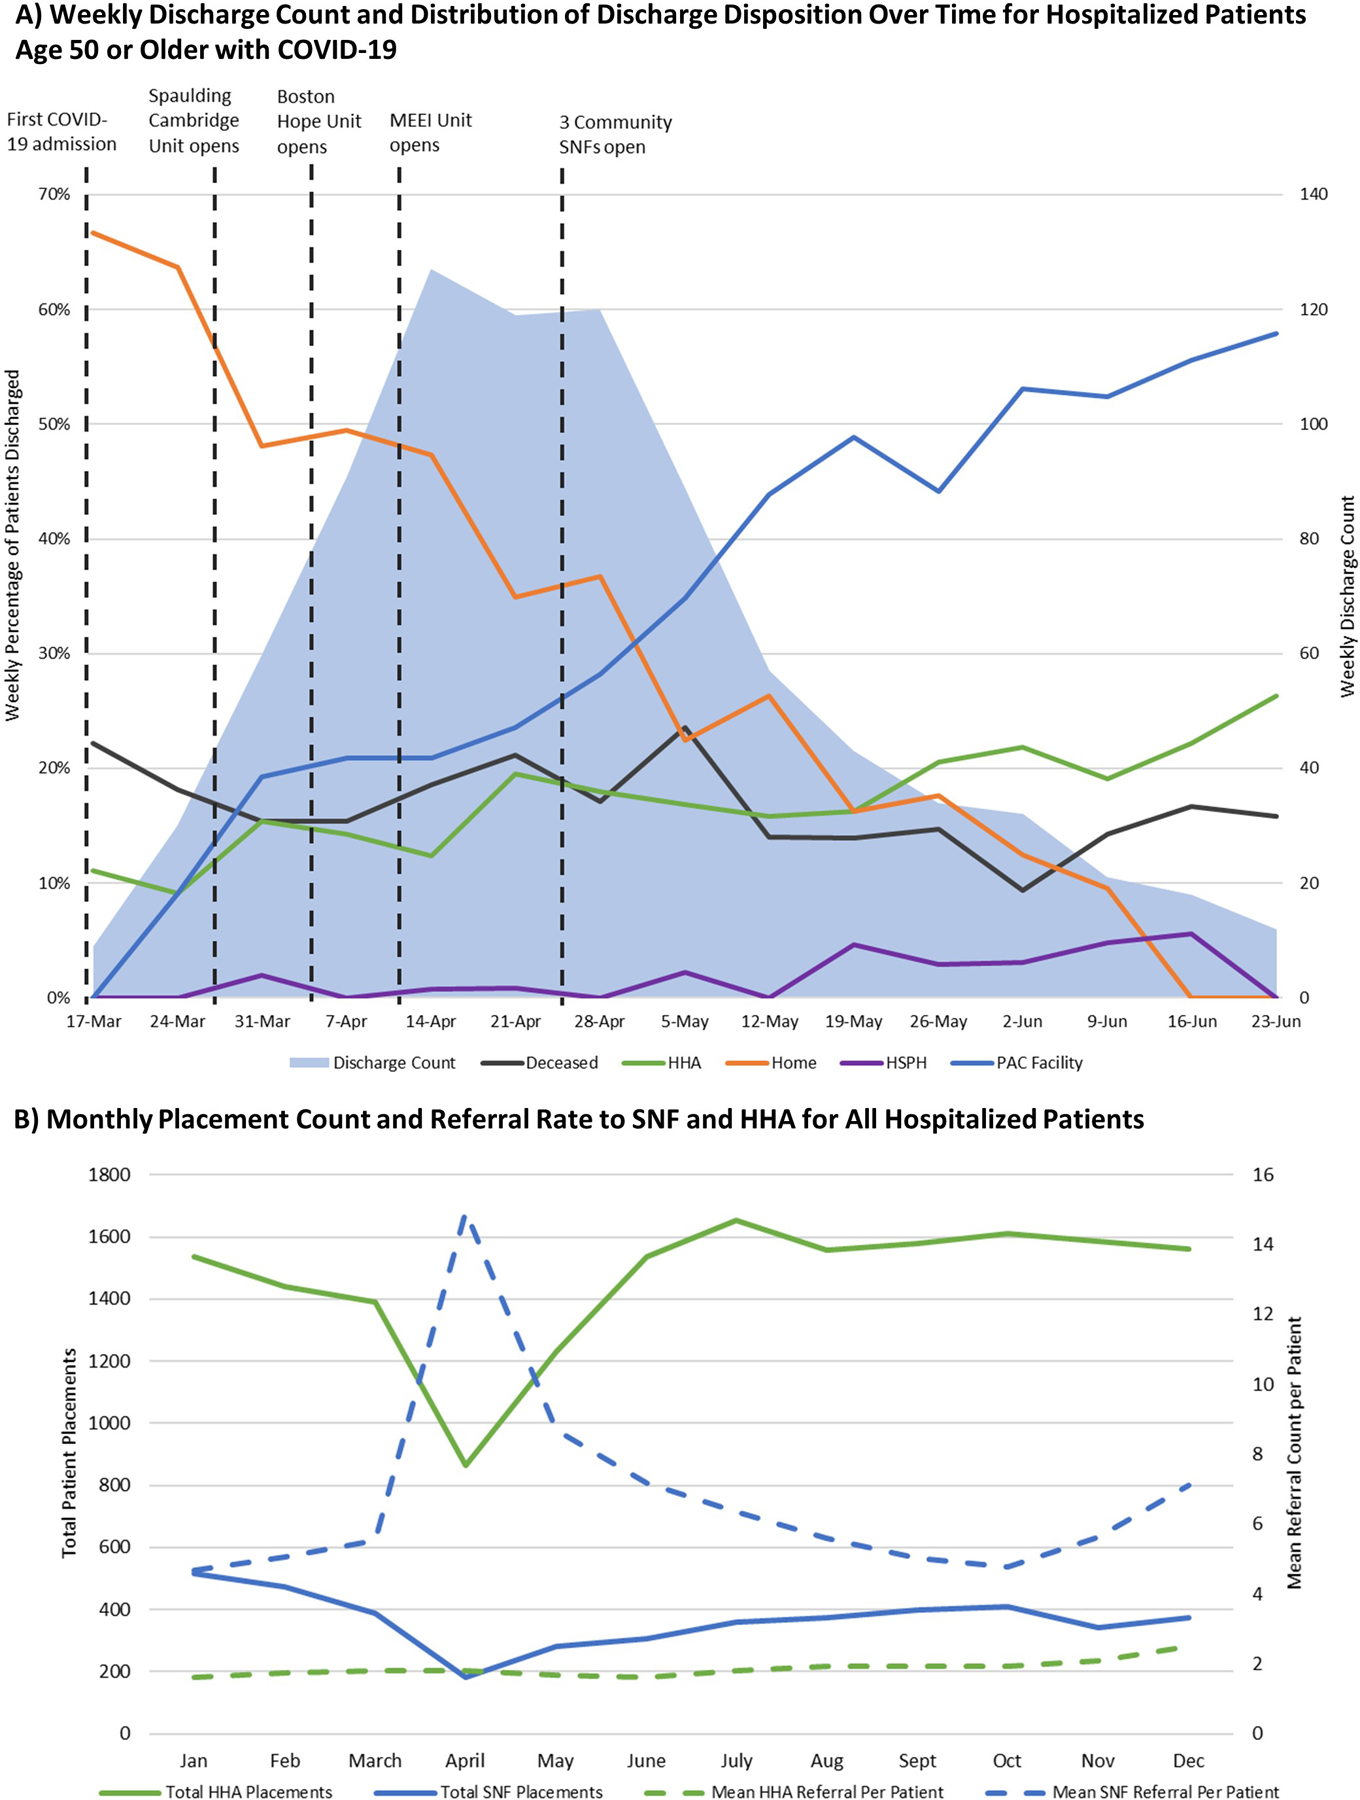
A) Weekly Discharge Count and Distribution of Discharge Disposition Over Time for Hospitalized Patients Age 50 or Older with COVID-19 shows the weekly discharge count and distribution of discharge disposition over time for admitted patients 50 years or older with COVID-19. The solid blue area represents the weekly discharge count and demonstrates the surge of COVID-19 cases. Each colored line represents the weekly percentage of discharged patients for each discharge disposition. The vertical dashed lines indicate relevant events including the date of the first admission of a patient with COVID-19 and the opening of dedicated PAC facilities for patients with COVID-19 in Boston, Massachusetts including units at Spaulding Hospital, Boston Hope Field Hospital, Massachusetts Eye and Ear Infirmary (MEEI) and three community SNFs.
B) Monthly Placement Count and Referral Rate to SNF and HHA for All Hospitalized Patients Shows the monthly average number of referrals made for SNF (blue dashed) and HHA (green dashed) and the monthly count of SNF (blue solid) and HHA (green solid) placements for all patients hospitalized during 2020.
