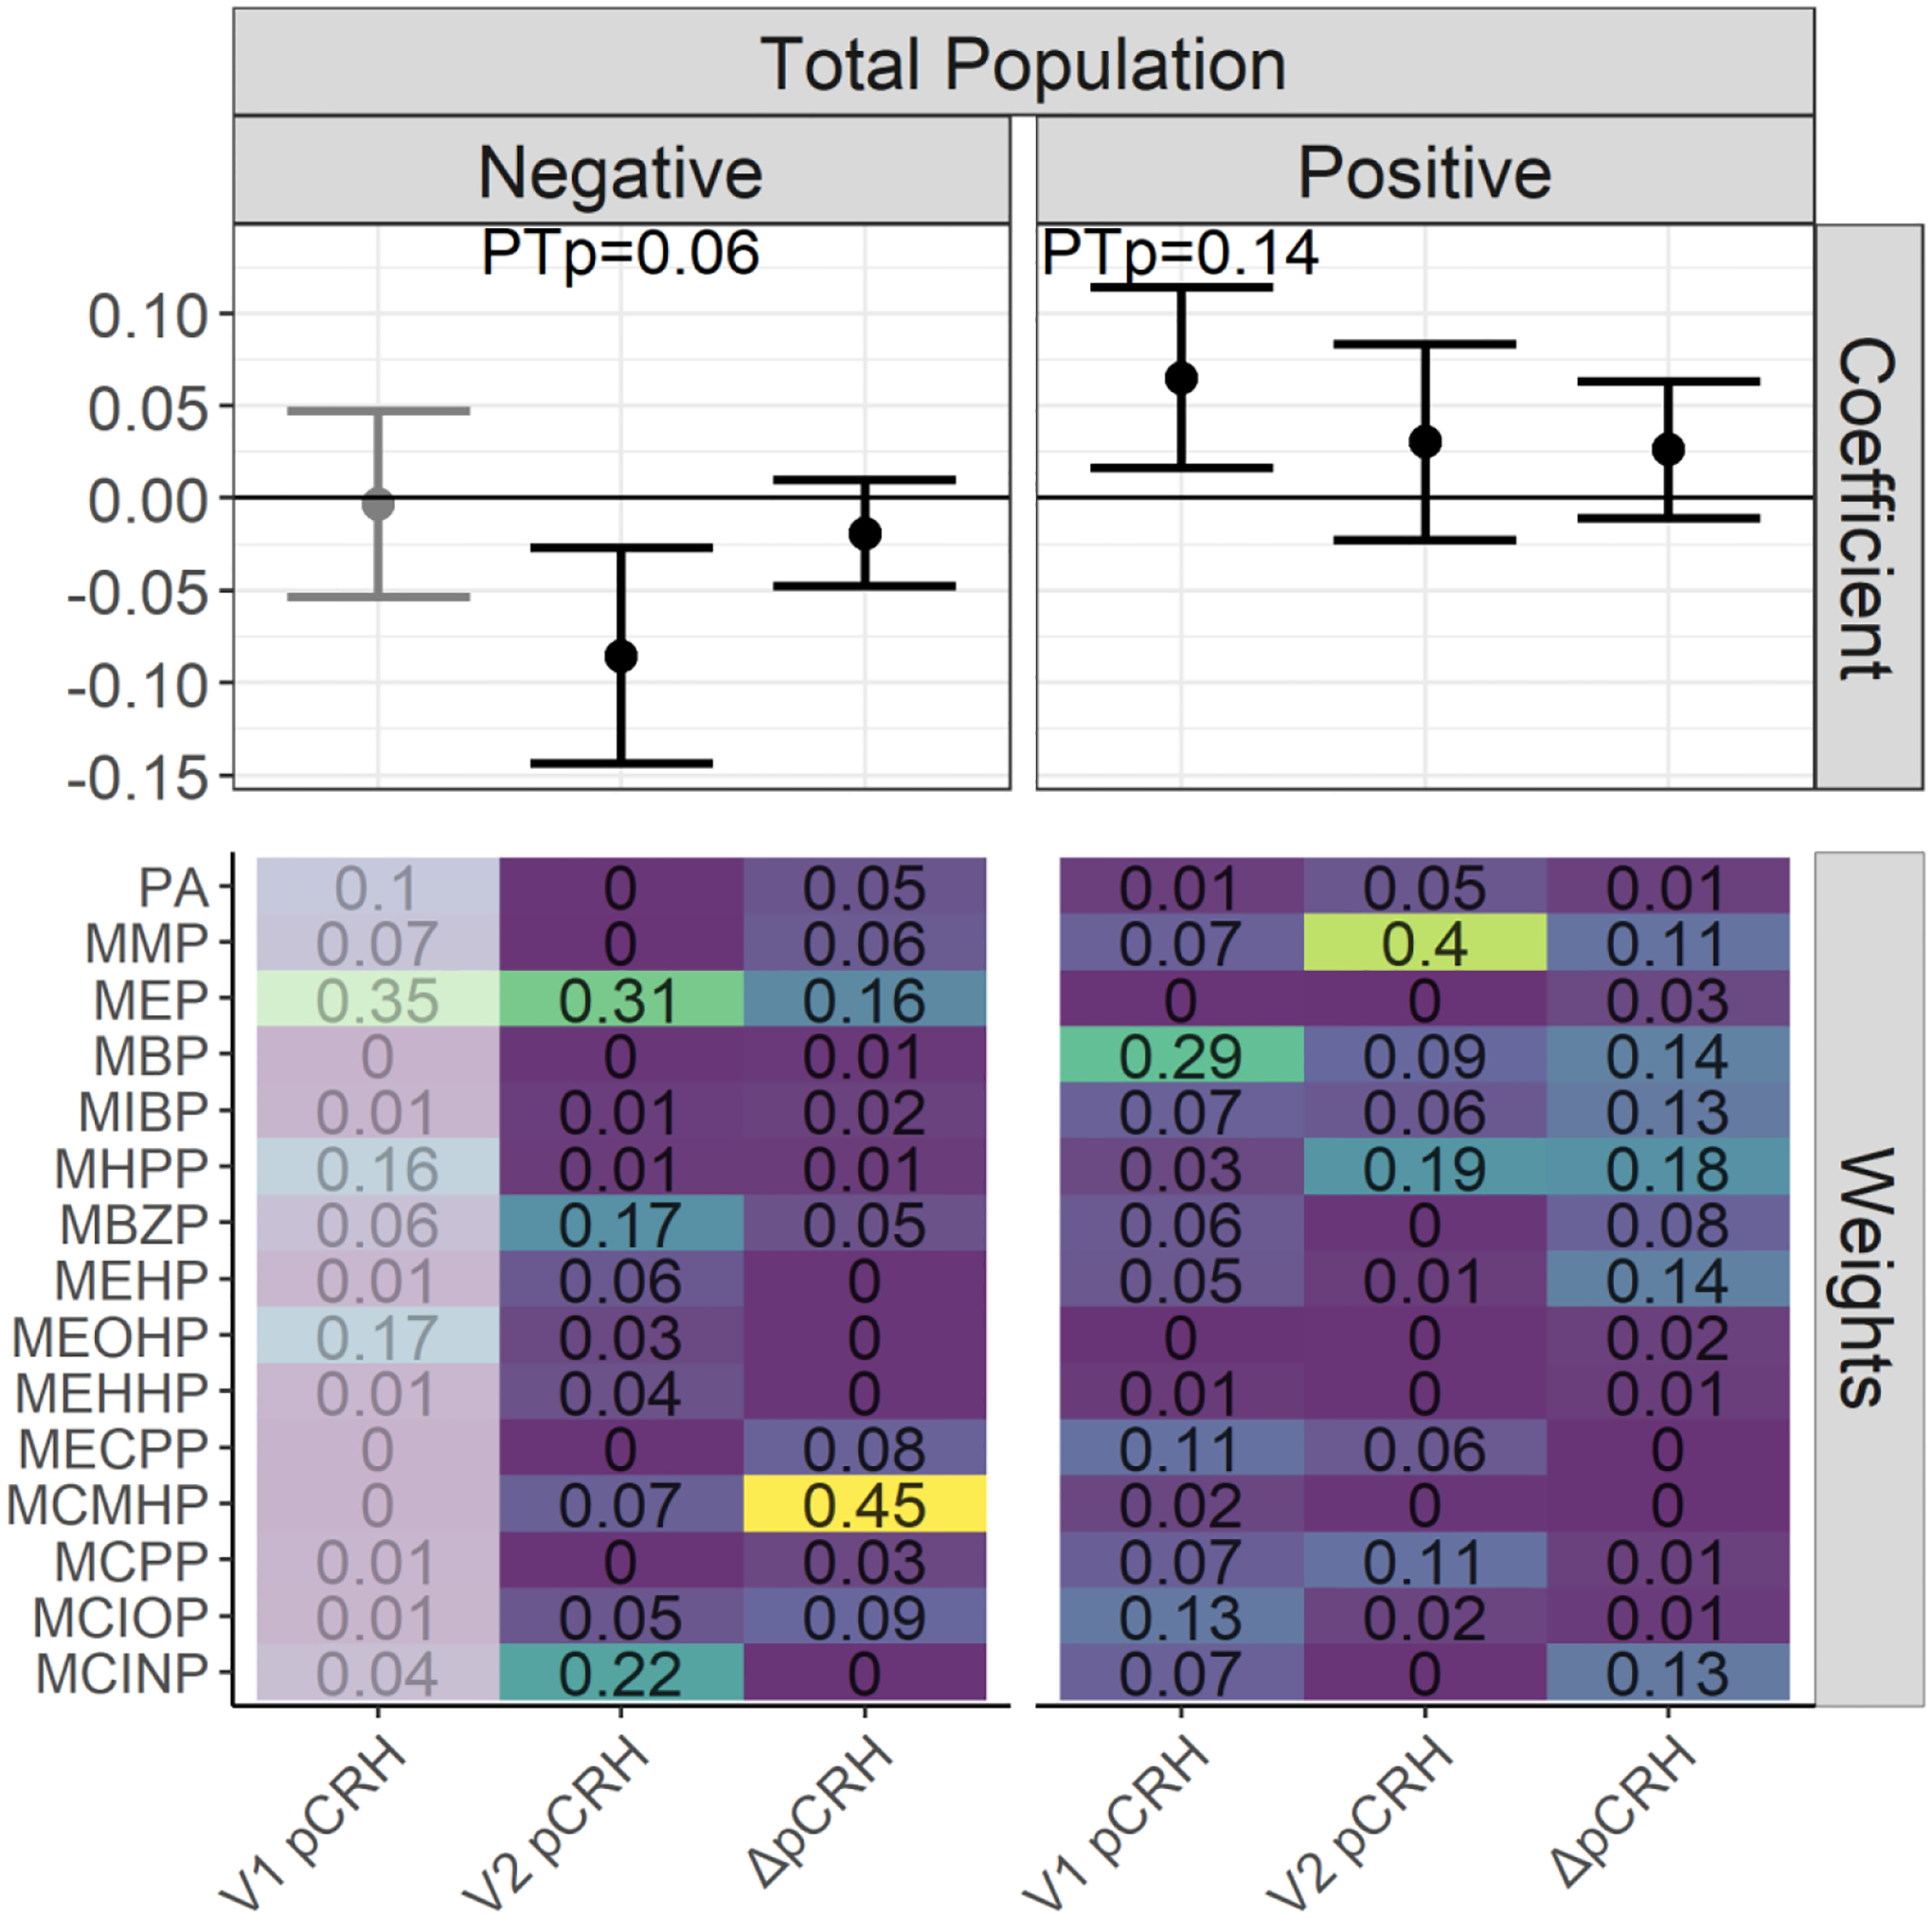
Figure 1.

WQS regression coefficients and weights for associations between phthalate mixtures and log(pCRH) in pg/mL1,2. The forest plots show WQS regression means and 95% CIs in the negative and positive directions. Permutation test p-value (PTp) indicates p-values after the application of the permutation test. WQS weights for all phthalate metabolites are indicated on the heat maps3.
1 Models adjusted for gestational age at sample collection, cotinine, maternal age, maternal race and ethnicity, marital status, fetal sex, maternal education, pre-pregnancy BMI, parity, gestational diabetes, gestational hypertension, and maternal childhood traumatic life events. Models examining the outcome ΔpCRH are additionally adjusted for the change in gestational age between the visits.
2 Exposure is Visit 1 phthalate metabolite concentrations for the outcome Visit 1 log(pCRH). Exposure is Visit 2 phthalate metabolite concentrations for the outcomes Visit 2 log(pCRH) and ΔpCRH.
3 The WQS regression coefficient and weight estimates in the negative direction for the V1 pCRH outcome are de-emphasized since these model results were derived from <100 (<10%) of the total bootstrap iterations within the WQS regression. These bootstrap iterations in a given direction are used to derive mixture weights and to compile to WQS mixture index, and so estimates based on only a few iterations in the desired direction may be unstable and should be interpreted with caution
