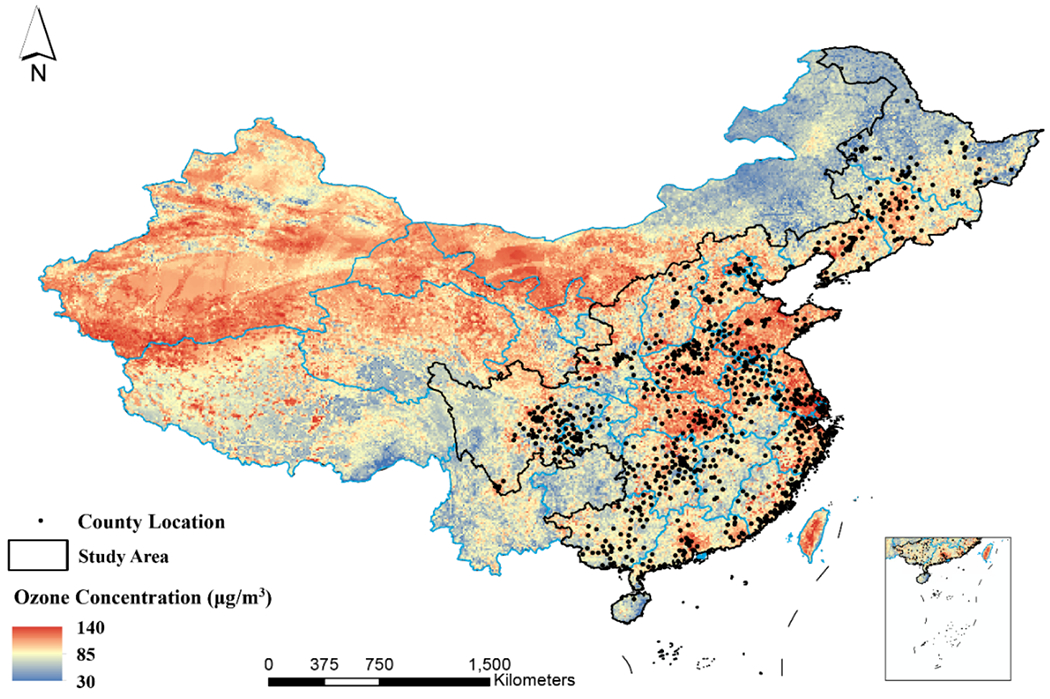
Fig. 2: Map of ozone concentrations in China during the study period (2005-2018).

The areas within the black lines represent the geographic regions covered by the CLHLS, including 23 provinces of China. Black points represent the location of counties where participants lived. The inset in the lower right corner indicates the South China Sea. Our study included a large national representative sample with highly diverse ozone exposure levels, covering the areas of lowest and highest ozone pollution in China.
