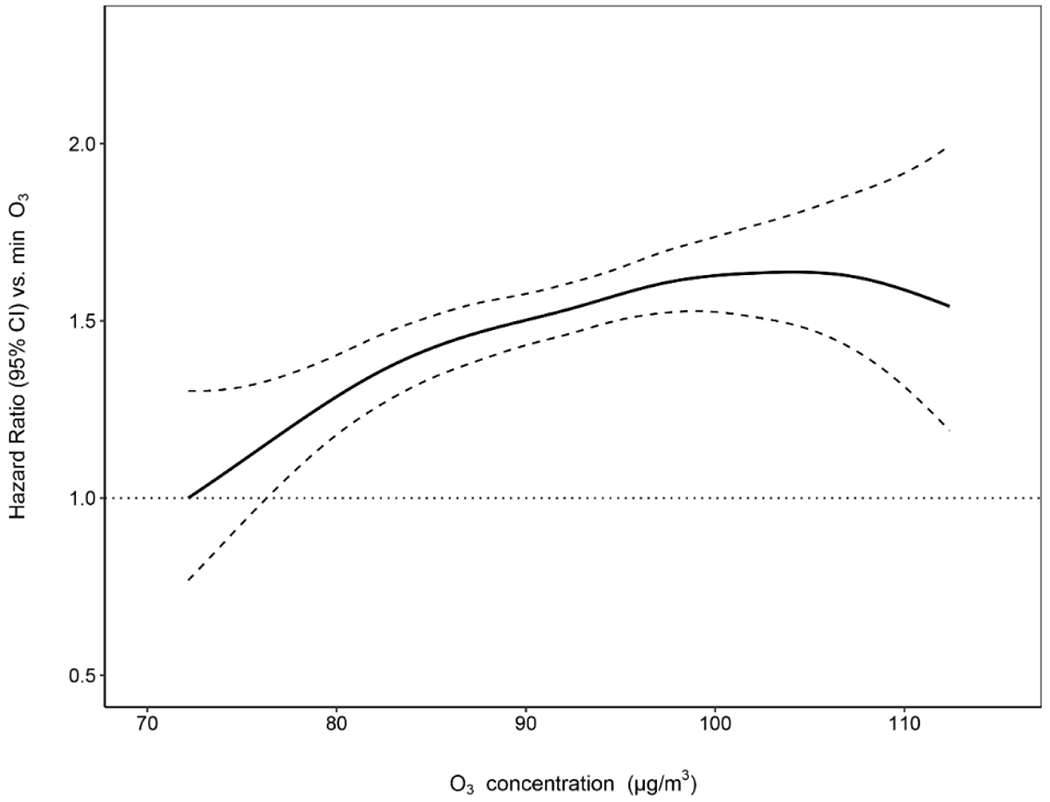
Fig. 4: Exposure-response curve for the association between long-term ozone exposure and risk of cognitive impairment.

Annual ozone exposure ranged from 72.2 to 112.4 μg/m3 (median: 92.4 μg/m3; interquartile range: 12.2 μg/m3) after restricting the ozone exposure level within the 1st and 99th percentiles to eliminate the large uncertainty due to sparse data. The 1st percentile of ozone exposure was set as the reference with the HR equal to 1. The dashed lines represent 95% CIs. HRs were estimated using the Cox proportional hazards model with penalized splines among 9,327 Chinese older adults aged 65 years and over. Covariates include age, sex, education, geographic region, residence, marital status, financial support, economic status, smoking status, drinking status, regular exercise, social and leisure activity, personality, disability, PM2.5, and air temperature. Abbreviation: HR, hazard ratio; CI, confidence interval; O3, ozone.
