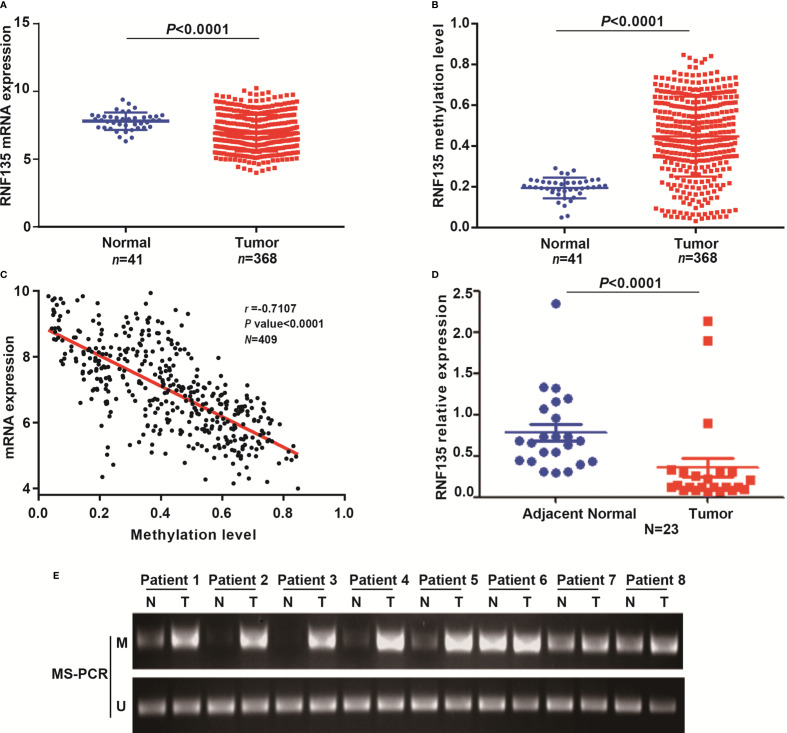
Figure 1.
RNF135 expression and methylation levels and analysis of their correlation in HCC tissues. (A) RNF135 mRNA expression data from TCGA were analyzed. (B) The average methylation level of 10 CpG sites was used to evaluate promoter methylation of RNF135. Promoter methylation levels in HCC tissues and adjacent non-tumor tissues were analyzed with TCGA data. (C) The correlation between RNF135 mRNA expression and methylation status was analyzed with TCGA data (Spearman’s correlation r = −0.7017, n = 409, p-value <0.0001) (D) RNF135 mRNA expression was measured by real-time quantitative PCR in 23 pairs of samples from SYSUCC. (E) MS-PCR (M, methylation; U, unmethylation) was used to detect methylation status in 8 pairs of samples from SYSUCC.

