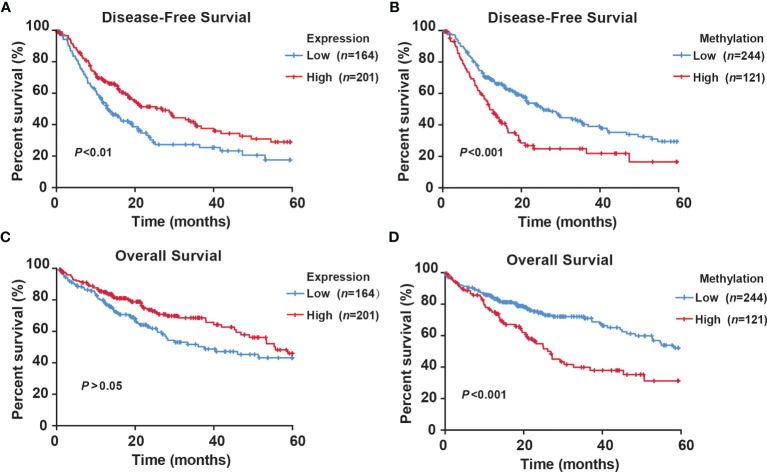
Figure 6.
Kaplan–Meier survival curve comparing high and low levels of RNF135 expression or methylation in HCC patients from the TCGA. (A) The disease-free survival curve for HCC patients with high or low expression level of RNF135. (B) The disease-free survival curve for HCC patients with high or low methylation level of RNF135. (C) The overall survival curve for HCC patients with high or low expression level of RNF135. (D) The overall survival curve for HCC patients with high or low methylation level of RNF135.

