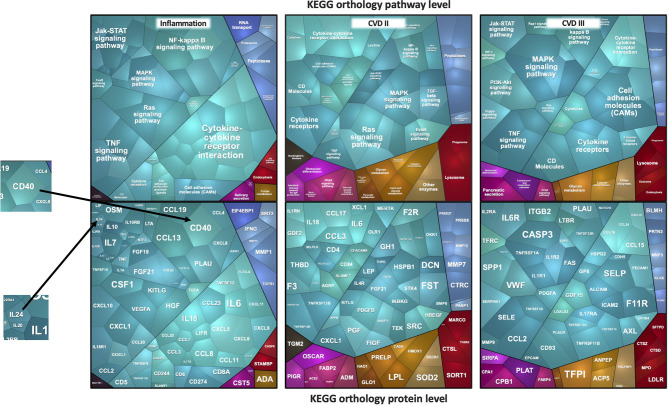
Figure 1.
Voronoi treemaps of proteins measured by the Olink platform. The median log2 intensities of proteins expressed as cell sizes in ICU plasma samples are depicted. The sizes of the polygons reflect protein intensity levels. In the top figures, panel-specific pathways are shown and grouped by identical color schemes if they belong to the same pathway. In the bottom figures, the corresponding protein names are shown.

