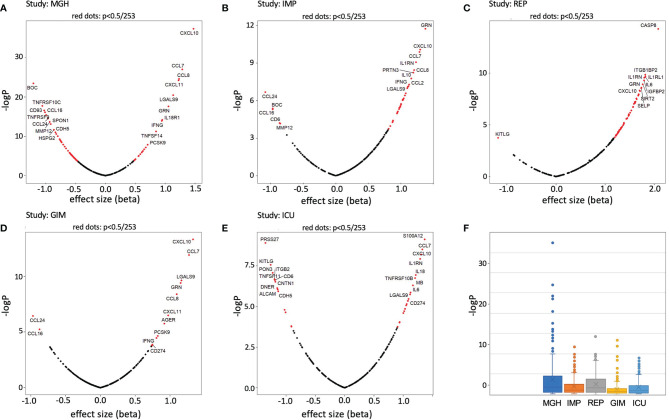
Figure 2.
Volcano plots and boxplots of differentially expressed proteins for MGH (A), IMP (B), REP (C), GIM NY (D), and ICU NY (E) studies. Proteins showing significant differences between case and control are shown in red. Change x-axis indicating control high on the left and COVID-19 high on the right. The top 10 proteins with the highest effect sizes and high p-values have been highlighted. In addition, p-value (-logP) boxplots of each study are shown in (F).

