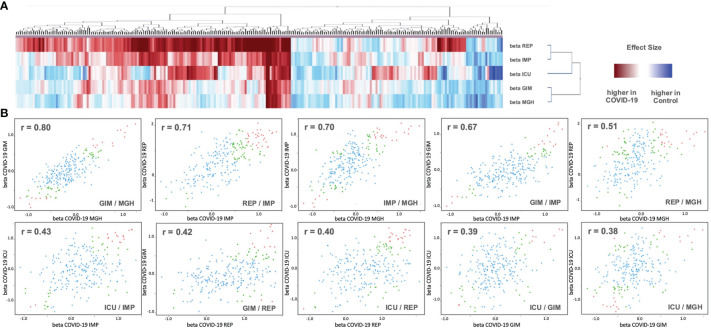
Figure 3.
(A) Analysis of 2D cluster pattern of all 253 beta values from the five studies is displayed. Coloring is based on beta values, with a higher abundancy in control in blue and a higher abundancy in COVID-19 in red. (B) Shown are 10 intergroup scatter plots of effect estimates from case vs. control ratios. Red indicates proteins that were Bonferroni significant at discovery level in one study (p < 0.05/2/Nprotein) and at replication level in the other (p < 0.05/Ndiscovery), where Nprotein ist the number of proteins tested and Ndiscovery the number of proteins reaching discovery significance in the first study. Green are proteins that reach nominal significance (p<0.05) in both studies. All other proteins are in blue (see Supplementary Data 1 for full summary statistics).

