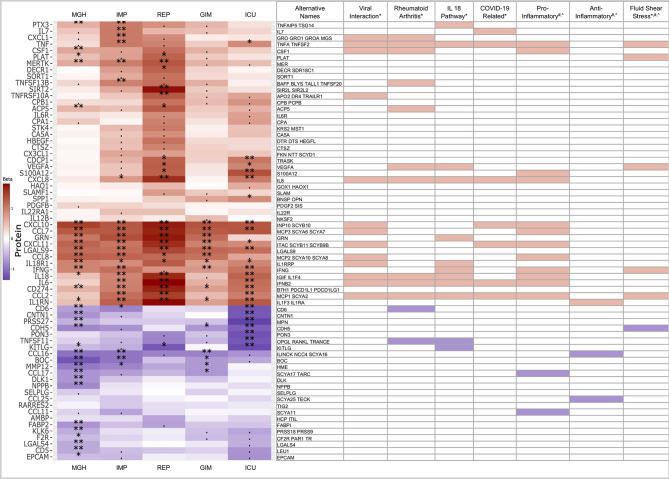
Figure 4.
Heatmap of 68 proteins differentially expressed across all five studies. Limited to proteins with similar trends (red: higher in case, blue: higher in controls), significance levels are indicated by ‘**‘ (p<0.05/253/5 = 4x10⁻⁵, Bonferroni level), ‘*‘ (p<0.05/116 = 0.00043, replication level, as there were 116 Bonferroni significant associations), “. “ (p<0.05, nominal significance). Selected assigned pathways/groups are shown. Pathway information was retrieved form g:Profiler (*), Uniprot (#) or literature analyses (^). The g:Profiler analysis included only pathways from KEGG, Reactome and Wikipathway.

