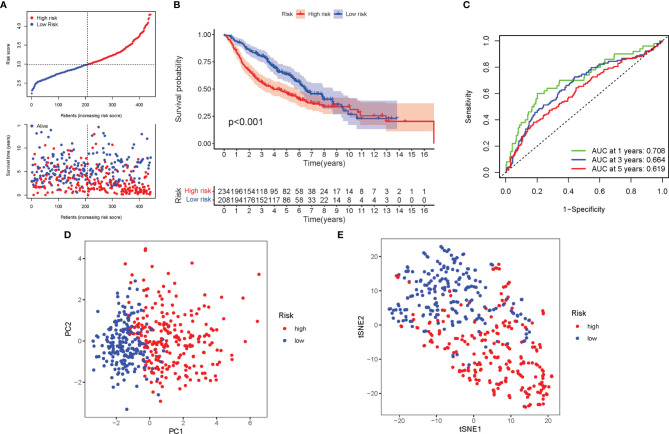
Figure 6.
Validation of the risk model in the GEO cohort. (A) The survival status for each patient (low-risk population: on the left side of the dotted line; high-risk population: on the right side of the dotted line). (B) Kaplan–Meier curves for the OS of patients in the high- and low-risk groups. (C) The AUC of the for the prediction of 1-, 2-, 3-year survival rate of LUAD. (D) PCA plot for LUADs based on the risk score. (E) t-SNE plot for LUADs based on the risk score.

