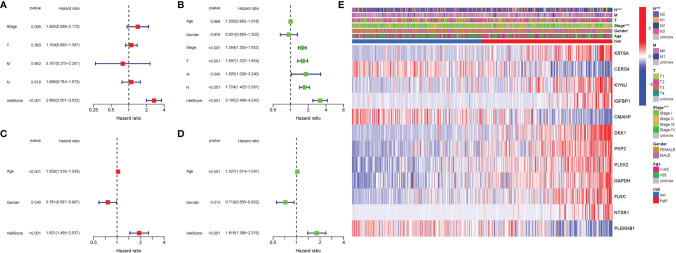
Figure 7.
Univariate and multivariate Cox regression analyses. (A) Multivariate analysis for TCGA cohort. (B) Univariate analysis for TCGA cohort (T, M, N, Stage: the degree of tumor differentiation). (C) Multivariate analysis for the GEO cohort. (D) Univariate analysis for the GEO cohort (Age, Gender). (E) Heatmap (green: low expression; red: high expression) for the connections between clinicopathologic features and the risk groups. ***P < 0.001.

