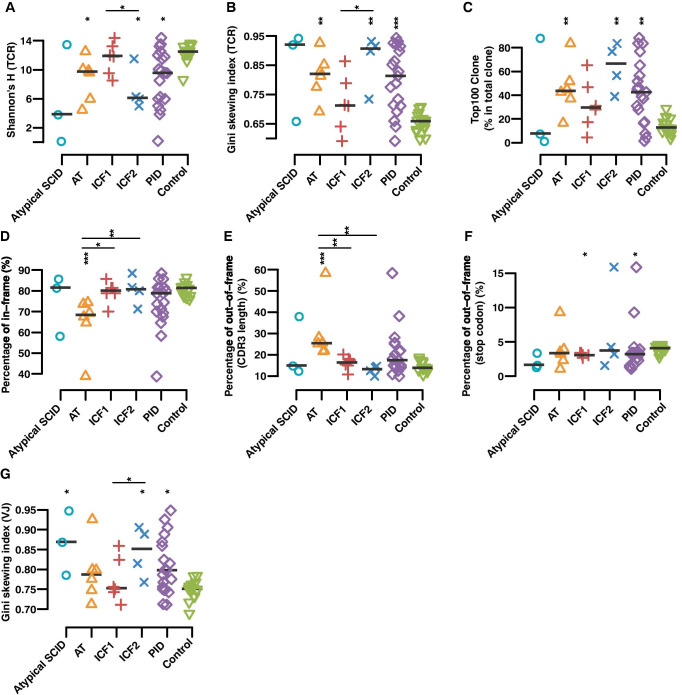
Fig. 1.
TCRβ repertoire diversity correlates with the severity of the clinical phenotype. A, B Scatter plot of Shannon’s H index of diversity (considering both the number of total sequences and clonal size distribution in the overall repertoire) (A) and Gini skewing index of unevenness (direct measure of TCR distribution among T cells to track subtle changes of the TCR repertoire among distinct populations of T cells) (B) were calculated to represent the quantification of the diversity and unevenness of TCR in different groups, where IEI represents all four patient groups taken together. C Percentage of top 100 abundant clones among the total TRB clones in patient groups and health individuals. D, E, F Percentage of in-frame CDR3 (D) and out-of-frame CDR3 rearrangement that either divided into those containing a stop codon within their sequence (E) or sequences with length of non-multiple of three (F). G Gini’s skewing index of V-J paring. The asterisk above each group indicate the significance tests between each group and normal controls, and asterisk above the line are p-values between two groups in the ends of line (p ≤ 0.05 *, p ≤ 0.01 **, p ≤ 0.001 ***, p ≤ 0.0001 ****, two-sided Wilcoxon Rank Sum Test followed by multiple testing correction)

